Figure 6.
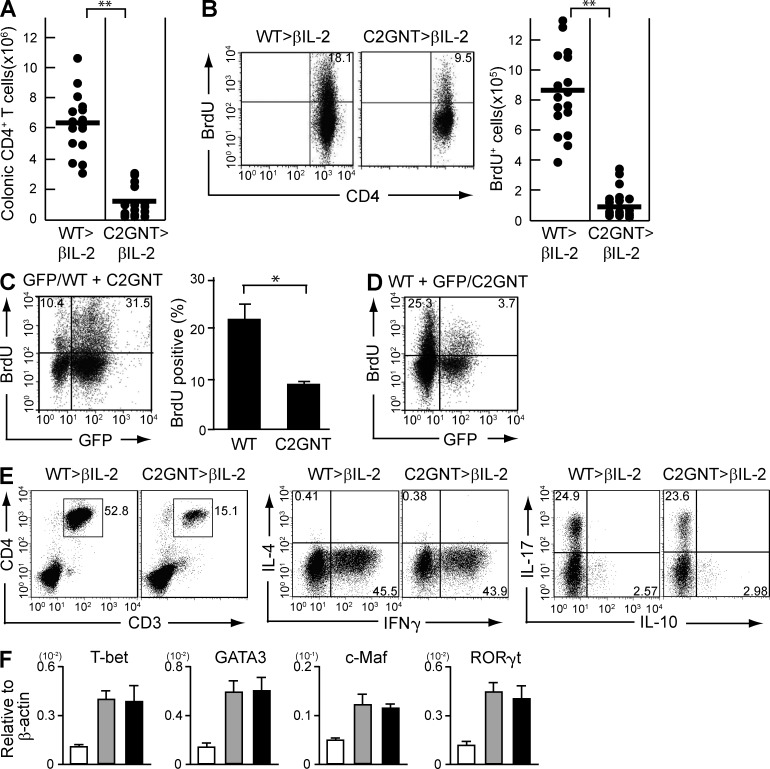
CAG-mediated stimulation of memory CD4+ T cell proliferation. (A and B) CD4+CD45RBlow memory T cells were purified from the spleen of WT (WT>βIL2) versus T/C2GnT Tg (C2GnT>βIL2) mice, and they were adoptively transferred i.v. into βIL-2 DKO mice. The recipients were sacrificed at 8 wk after T cell transfer. (A) Absolute numbers of colonic CD4+ T cells in the recipient are shown. Each dot represents an individual mouse. (B) Proliferative responses of colonic CD4+ T cells are shown. The absolute numbers of BrdU+CD4+ in the colon is summarized in right panel. (C) Purified CD4+CD45RBlow memory T cells from the spleen of GFP Tg versus C2GnT Tg mice were co-transferred into βIL-2 DKO mice. The proliferative response of reconstituted GFP+ CD4+ (WT-derived) versus GFP− CD4+ (C2GnT tg–derived) cells in the same recipient colon are shown. Right panel summarizes the average of percentages (n = 5) of BrdU+ cells in GFP+ versus GFP− CD4+ T cells. (D) Purified CD4+CD45RBlow memory T cells from the spleen of WT versus GFP-expressing C2GnT-expressing double Tg mice were co-transferred into βIL-2 DKO mice. The proliferative response of reconstituted GFP− CD4+ (WT-derived) versus GFP+CD4+ (C2GnT tg–derived) cells in the same recipient colon are shown. (E) Left panels show the proportion of CD3+CD4+ T cells in the colonic lamina propria cells of recipient βIL-2 DKO mice reconstituted with WT-derived (WT>βIL2) versus T/C2GnT tg–derived (C2GnT>βIL2) memory CD4+ T cells. The proportion of IL-4, IFN-γ, IL-17A, and IL-10–producing cells in the colonic CD4+ T cell population is then examined after ex vivo stimulation. Data shown are one representation of three independent experiments. (F) Expression levels of T-bet, GATA3, c-Maf, and RORγt in purified CD4+ T cells from the colon of WT mice (white bars, n = 6) and of βIL-2 DKO mice reconstituted with WT-derived (gray bars, n = 19) versus T/C2GnT tg–derived (black bars, n = 13) memory CD4+ T cells are shown. *, P < 0.01; **, P < 0.0001.

