Figure 3.
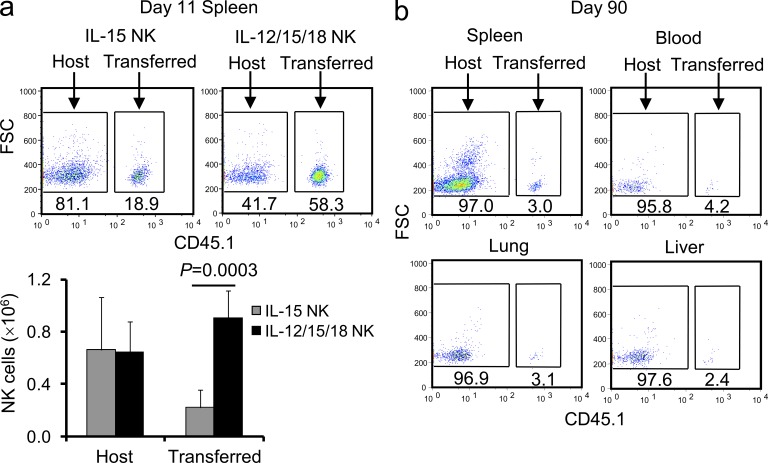
IL-12/15/18–preactivated NK cells persist in recipient mice. RMA-S tumor–bearing mice received RT and preactivated NK cells as described in Fig. 2 b. 11 or 90 d after NK transfer, the numbers of host and transferred NK cells were analyzed. (a) Host (CD45.1−) and transferred (CD45.1+) NK cells in spleen on day 11 are shown. Cells were gated on CD3ε−NK1.1+ NK cells, and one representative dot plot from each group is shown (top). Numbers indicate percentages of host and transferred NK cells. Numbers of NK cells are depicted in the bottom panels. Graphs indicate mean + SD (n = 5). Data are representative of two independent experiments. (b) Representative dot plots (n = 3) of host (CD45.1−) and transferred (CD45.1+) NK cells on day 90 after transfer of IL-12/15/18–preactivated NK cells are shown from spleen, blood, lung, and liver of animals that had rejected the tumors. Cells were gated on CD3ε−NK1.1+ NK cells. Data are representative of two independent experiments.

