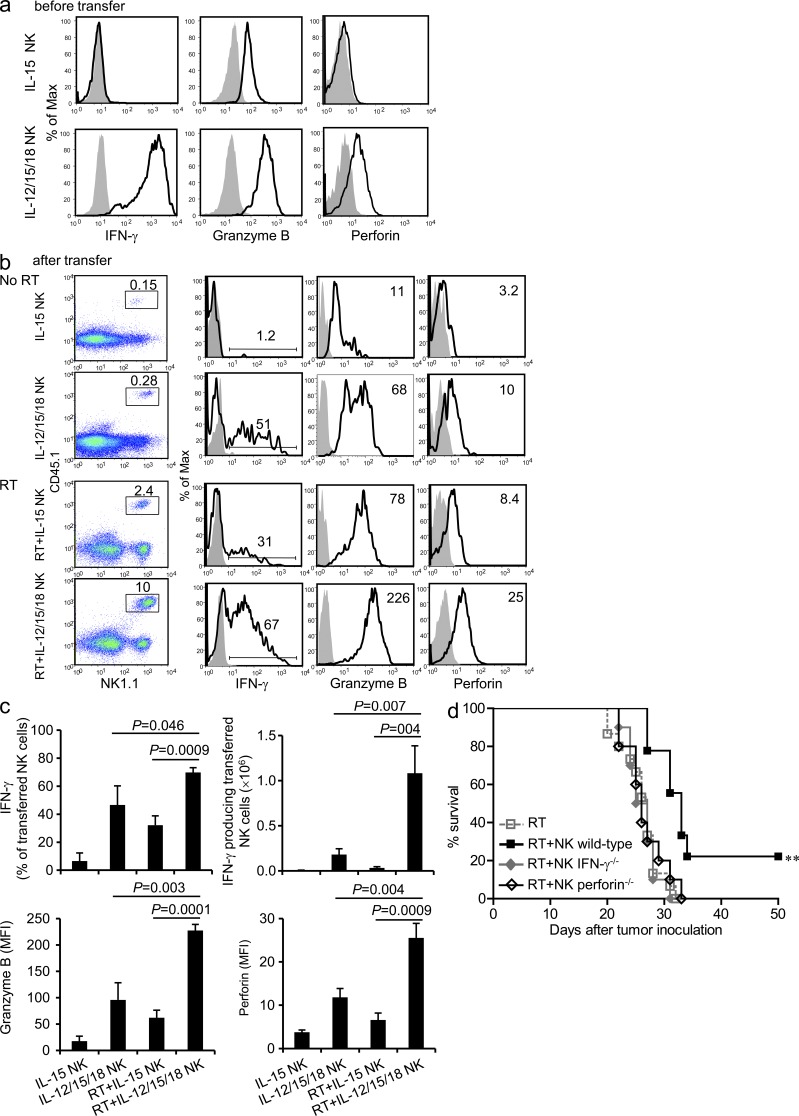
Figure 7.
IL-12/15/18–preactivated NK cells show high effector function before and after transfer into irradiated recipients. (a) NK cells were pretreated with IL-15 or IL-12/15/18 for 16 h. Expression of IFN-γ, granzyme B, and perforin (bold black lines) or the isotype control (filled histograms) was determined by flow cytometry. Data are representative of three independent experiments. (b and c) IL-15– or IL-12/15/18–pretreated NK cells (CD45.1+) were transferred into untreated (No RT) or irradiated (RT) tumor-bearing mice (CD45.2+) as described in Fig. 2 b. 4 d later, splenocytes were restimulated by RMA-S cells and stained with anti–IFN-γ, anti–granzyme B, and anti-perforin mAbs (bold black lines) or the isotype control (filled histograms; b). Dot plots (left) depict whole splenocytes. Histograms (right) are gated on CD45.1+NK1.1+ cells as indicated in the left panel. Numbers indicate percentages of IFN-γ–producing cells among the transferred NK cells or mean fluorescence intensity (MFI) of granzyme B and perforin expression. One representative dot plot or histogram from each group is shown. (c) Numbers of IFN-γ–producing transferred NK cells and mean fluorescence intensity of granzyme B and perforin detected in transferred NK cells are depicted. Graphs indicate mean + SD (n = 3). Data shown are representative of two independent experiments. (d) NK cells from wild-type, IFN-γ−/−, or perforin−/− mice were stimulated with IL-12/15/18 for 16 h and transferred into tumor-bearing, irradiated mice 7 d after tumor inoculation. Survival data are outlined from two experiments (n = 15, 9, 10, and 10 for RT, RT+NK wild-type, RT+NK IFN-γ−/−, and RT+NK perforin−/− groups, respectively) and presented as a Kaplan–Meier survival curve. ** , P < 0.01 compared with the other groups.

