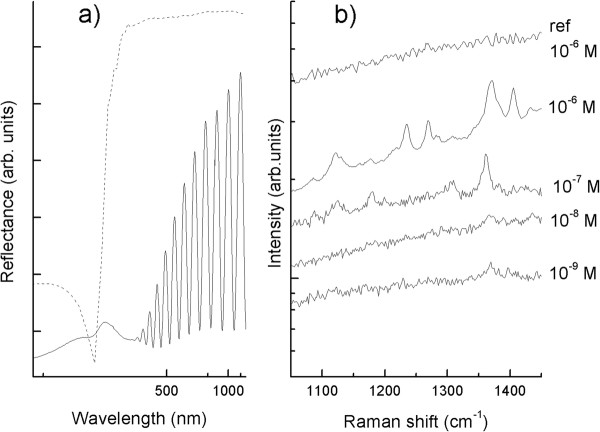
Figure 6.
Experimental reflectance spectrum and SERS spectra. (a) Experimental reflectance spectrum of patterned Ag NPs (continuous line) compared to a calculation concerning with a homogeneous Ag thin film (dashed line). (b) SERS spectra of Cy-3-OCH3 dye at different concentration spotted on the same substrate. As a reference, the top graph shows the detected Raman spectrum of 10−6-M dye molecules on bare p-Si.

