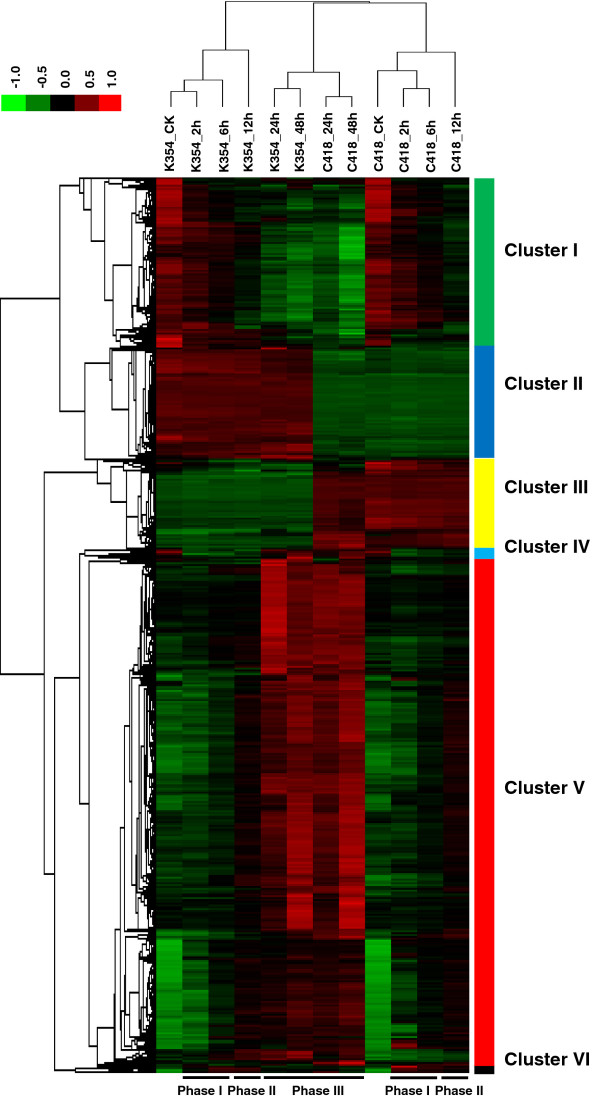
Figure 2.
Heat map of differentially expressed genes. 3184 DEGs (2562 cold-responsive DEGs and 710 genotypic-specific DEGs) identified in C418 and K354 under control and stress conditions were analyzed by hierarchical clustering. A heat map was constructed using the log-transformed and median-normalized expression values of the genes based on centered correlation distance and average linkage method. As a result, the 3184 genes were grouped into 6 clusters based on the genotypic-temporal pattern of gene expression. Relatively high expression values are shown in red.

