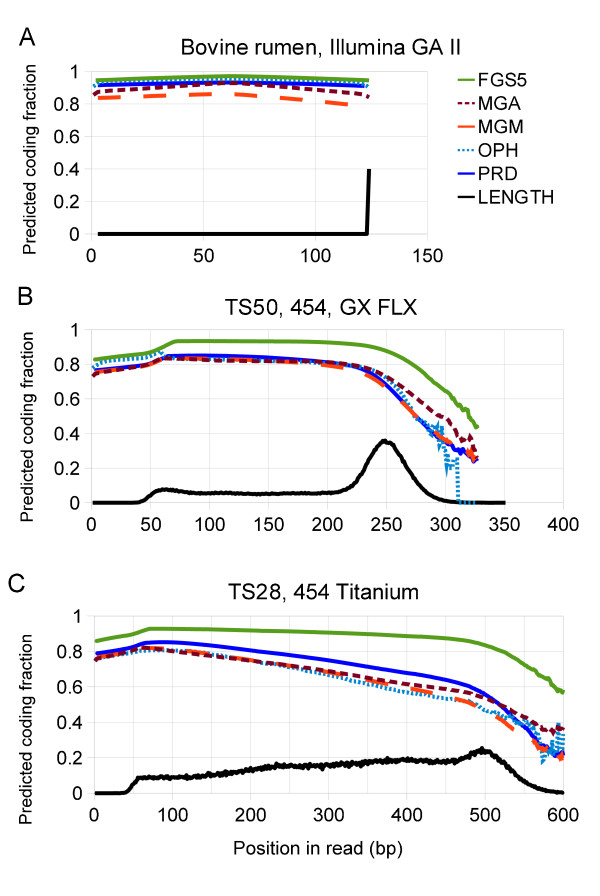
Figure 4.
Predicted coding fractions as a function of position in read for three metagenomic datasets. The black lines are proportional to the read-length histograms. All the gene predictors predict fewer genes at the end of fragments. Compare with Additional file 3: Figure S2.

