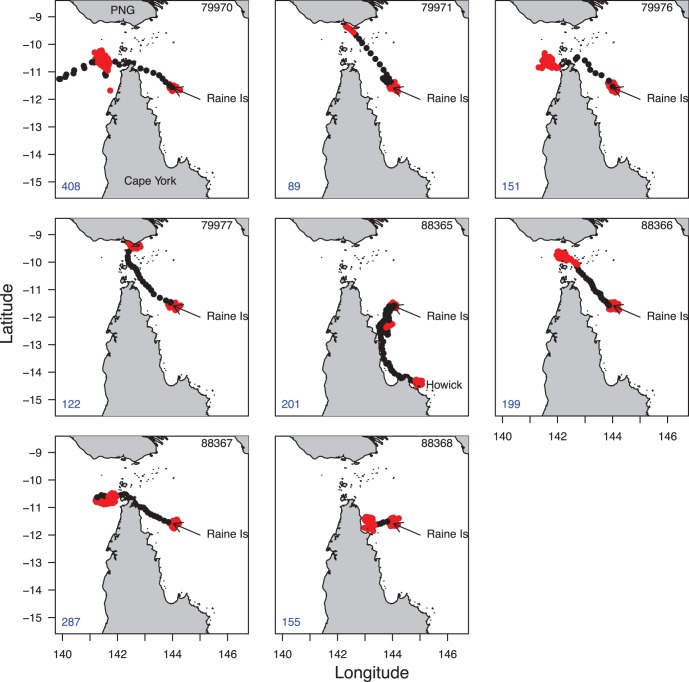
Figure 1. Movement path of each green turtle.
Turtle ID is indicated in the top right and duration of the deployment in the bottom left of each map. Each turtle’s path is coded by behavioural mode; red = area-restricted search and black = transit. Maps show Cape York Peninsula, Raine Island and the bottom of Papua New Guinea (PNG) (top).

