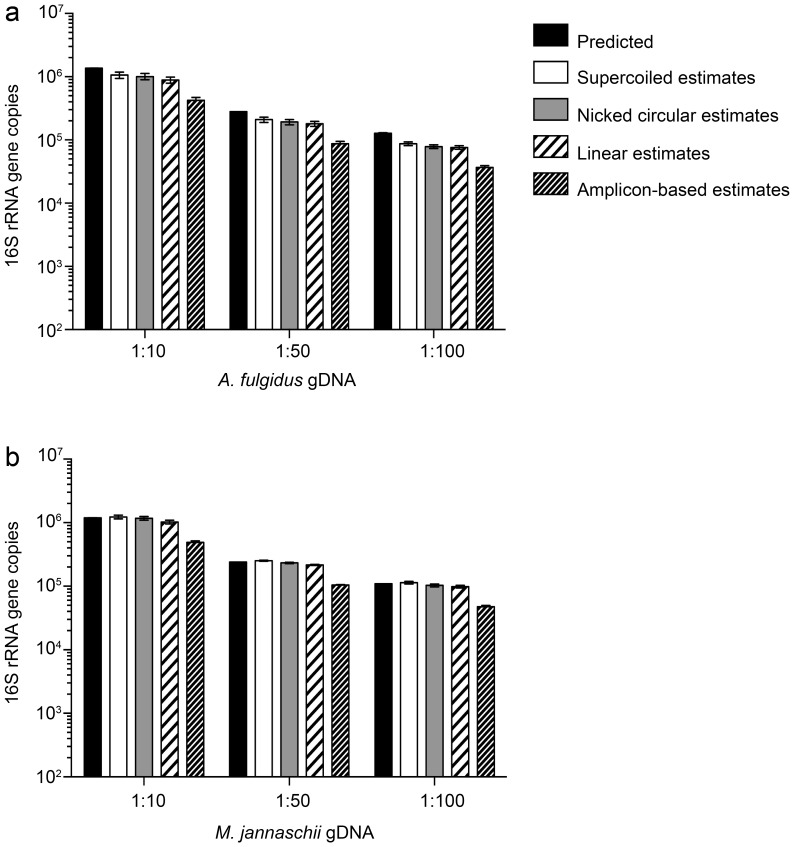
Figure 4. Comparison of expected and estimated 16S rRNA gene copies in archaeal DNA samples.
Expected archaeal 16S rRNA gene copies were calculated based on one and two 16S copies per genome for (a) A. fulgidus and (b) M. jannaschii, respectively. Black bars = predicted 16S copies. White bars = estimated 16S copies based on supercoiled plasmid standard. Grey bars = estimated 16S copies based on nicked circular plasmid standard. Black and white striped bars = estimated 16S copies based on linearized plasmid standard. Black and gray striped bars = estimated 16S copies based on amplicon standard. Data shown are representative of two experiments. Data are the average (n = 3) and error bars are ±1 standard deviation among replicates.

