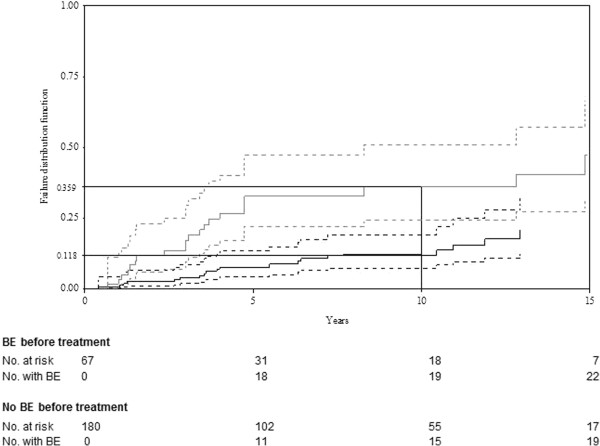
Figure 3.
Impact of BE before treatment on BE occurrence under ERT/SRT for 247 treated GD patients. The solid bold grey line represents patients without BE before treatment; the solid bold black line represents the times to first BE. Dashed lines represent the 95% CI of those curves; the estimated probability of BE occurrence after 10 years reported on the y-axis.

