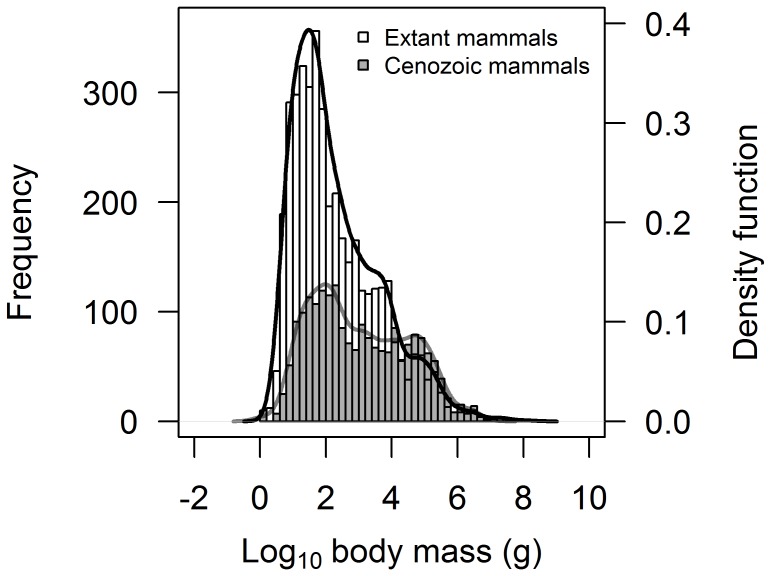
Figure 3. Frequency distribution of maximum species body size for Cenozoic mammals (in grey) overlaid on the distribution for extant mammals (in white).
Curve fitting is based on a combination of kernel density estimation and smoothed bootstrap resampling. The figure clearly highlights the reduced frequency of small-bodied species in the Cenozoic mammal dataset, while the frequency of large-bodied species is comparable between both datasets.

