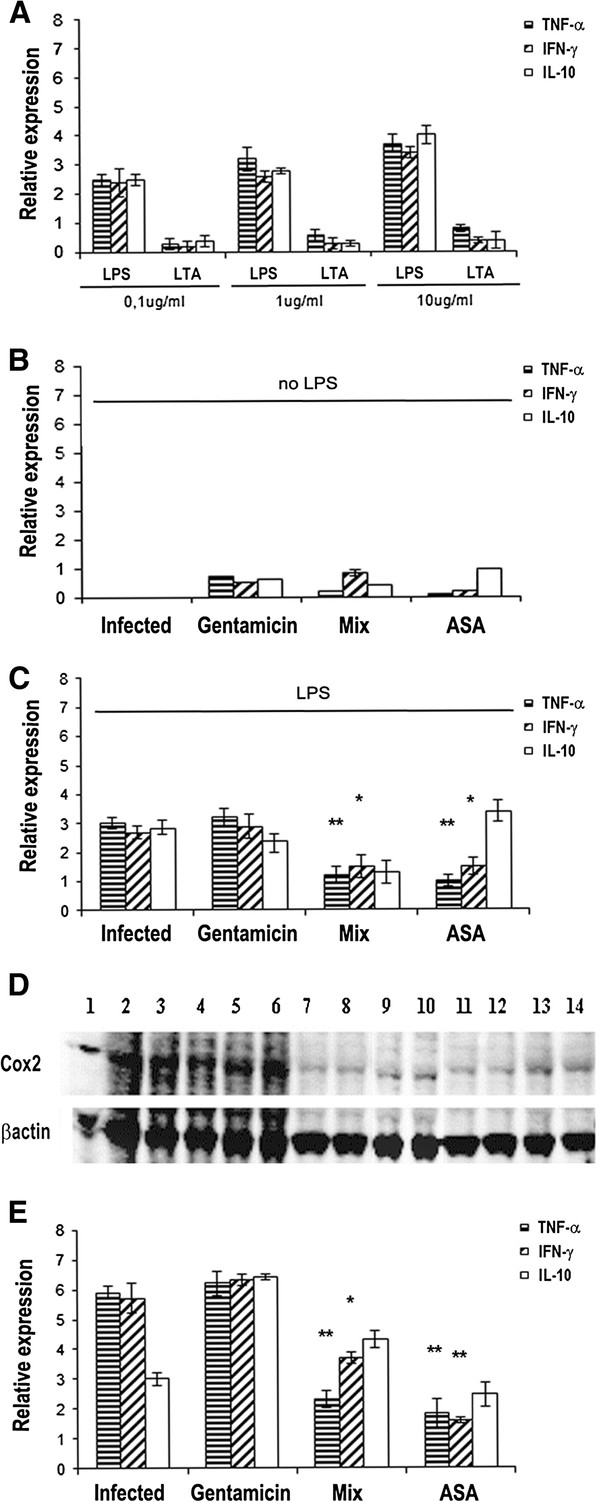
Figure 3.
(A) TNF-α, IFN-γ, IL-10 mRNA expression levels in J774 cells stimulated with LPS or LTA (0,1,1 or 10 μg/ml) for 3 hours. (B) J774 cells treated with gentamicin (5 μg/ml) or MIX (RJI-C 9 μg/ml + TB-KK 6 μg/ml) or ASA (5 μg/ml) for 3 hours. (C) J774 cells stimulated with LPS (10 μg/ml) for 3 hours and treated with gentamicin (5 μg/ml) or MIX (RJI-C 9 μg/ml + TB-KK 6 μg/ml) or ASA (5 μg/ml) for further 3 hours. (D) Western blot analysis of COX-2 in J774 cell line. Lane 1–3: J774 cells + LPS(10 μg/ml); Lane 4–6: J774 cells + LPS (10 μg/ml) + inactive peptide (RJII-C 15 μg/ml); Lane 7–9: J774 cells + LPS (10 μg/ml) + ASA (5 μg/ml); Lane 10–12: J774 cells + LPS (10 μg/ml) + MIX (RJI-C 9 μg/ml + TB-KK 6 μg/ml; Lane 13–14: J774 cells + LPS (10 μg/ml) + gentamicin (5 μg/ml). (E) TNF-α, IFN-γ, IL-10 mRNA expression levels in kidney of mice (3mice/group) stimulated with LPS (250 μg, ~10 mg/Kg) for 3 hours; stimulated with LPS (250 μg, ~10 mg/Kg) for 3 hours and treated with gentamicin (5 μg/mouse) or MIX (RJI-C 9 μg/mouse + TB-KK 6 μg/mouse) or ASA (5 μg/mouse) for 3 hours. Values were normalized with GAPDH and compared to untreated control. *P <0.05, **p < 0.01; ***p < 0.001, Student’s t test gentamicin vs MIX and gentamicin vs ASA.

