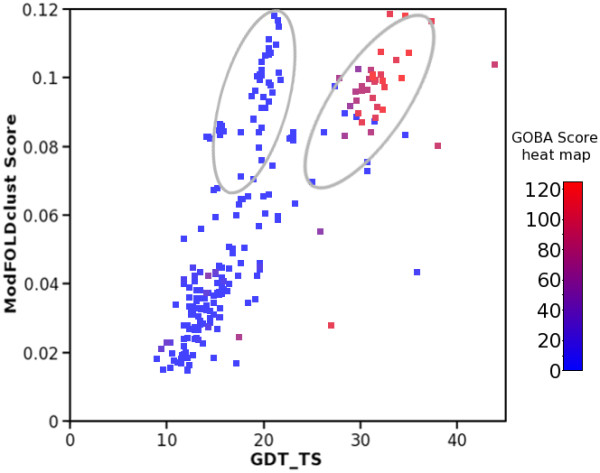
Figure 10.

The example of T0429 presents a case where GOBA is superior over all other methods in CASP8. Assessment of models submitted by ModFOLDclust. The models formed two structural clusters, which can be observed as two distinct groups (encircled) on the ModFOLDclust vs GDT_TS graph. All points are colored using a blue-red color scale, which is based on GOBA yGA579 scores. Blue and red colors are assigned, respectively, to worst and best models in terms of yGA579. In this case the consensus method erroneously treated the two clusters as equivalent, while GOBA correctly assigned lowest scores to models from the first cluster and higher scores to models from the second one.
