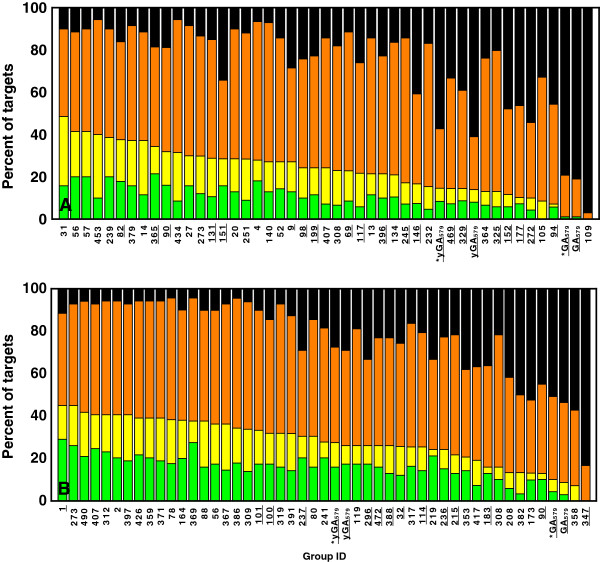
Figure 12.
Performance comparison between GOBA and model quality assessment programs from (A) CASP8 and (B) CASP9 based on ΔGDT analysis. The bars show the percentage of cases where ΔGDT for a given MQAP was: less than 1 - green , [1,2) - yellow, [2,10) – orange or greater than 10 - black. Single and quasi-single model methods are underlined. Asterix next to GOBA score name denotes that outliers exclusion procedure was applied.

