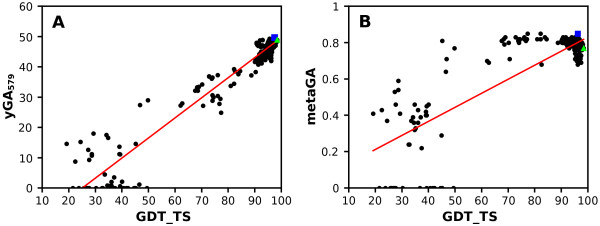
Figure 4.
Quality assessment of T0458 (3dex). Exemplary performance. GOBA predicted quality scores of an exemplary CASP8 target, yGA579(A), metaGA (B), are plotted against the observed quality of models using the GDT_TS score. Pearson correlations are (A) 0.97 and (B) 0.84 respectively. Best models according to GOBA metrics are marked with blue rectangles, while the objectively best model is marked with green triangles. The GDT differences between GOBA and objectively best model are 0.98 (A) and 2.28 (B).

