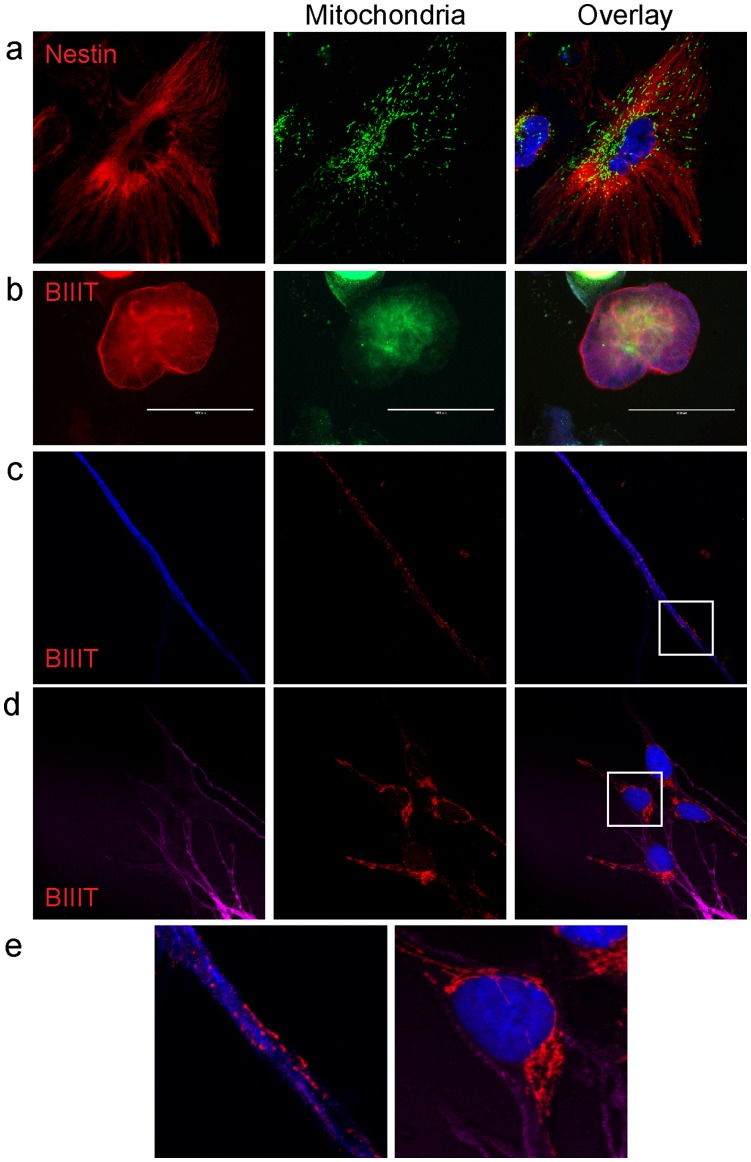
Figure 4. Mitochondrial localisation during neural lineage differentiation.
Neural lineage specific differentiation showing KMEL2 positive for (a) Nestin and (c-e) β-III-tubulin. β-III-tubulin positive cells show expanded localisation of mitochondria through dendritic outgrowths (c and e). βIIIT, β-III-tubulin. Scale bars in (b) are 1000 µm. All other images are 150 µm wide. Enlarged images in (e) are shown in the boxed regions of (c) and (d).

