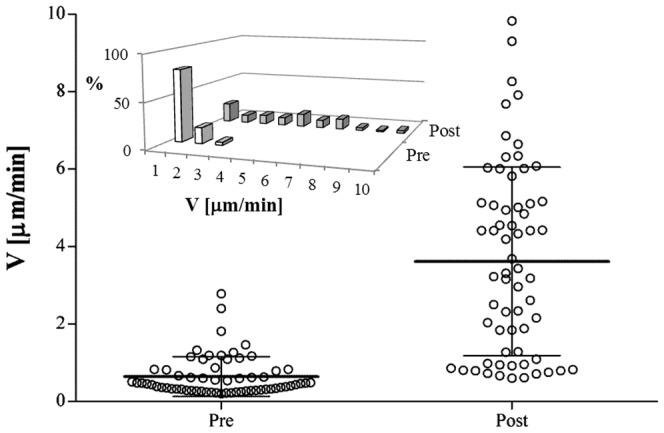
Figure 7. Average cell velocity module V calculated over the entire Pre IL-8 and Post IL-8 periods for each of the 63 cells from donor A.

The continuous line is the average value, the error bar corresponds to the standard deviation for each population. Data are statistically significant (p<0.0001). In the inset the same data are plotted as a numerical distribution.
