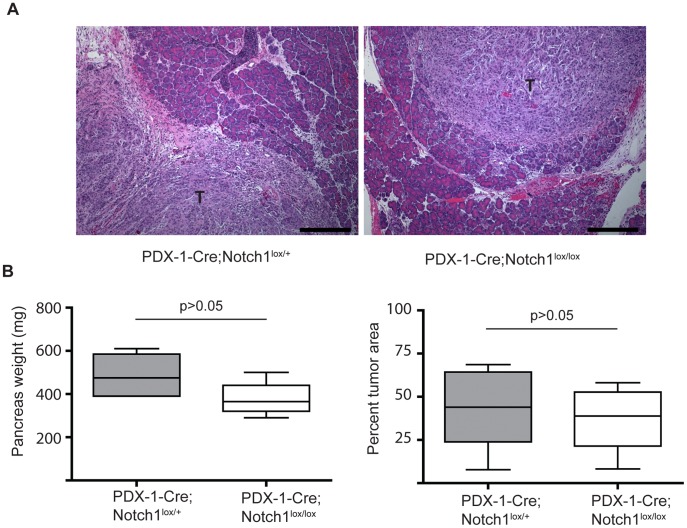
Figure 5. Notch1 functions in a cell autonomous manner.
(A) Representative images of orthotopic tumors in Pdx1-cre;Notchlox/+ and Pdx1-Cre;Notch1lox/lox mice. Tumor cells (T) are seen adjacent to normal pancreatic tissue. Scale bar, 300 µm (B) Quantitative analysis of pancreas weight and percentage of tumor volume in Pdx1-Cre;Notchlox/+(n = 5) and Pdx1-Cre;Notch1lox/lox (n = 6) mice 2 weeks after orthotopic injections. Box plots depict median values, lower and upper quartiles, and maximum and minimum observed values.

