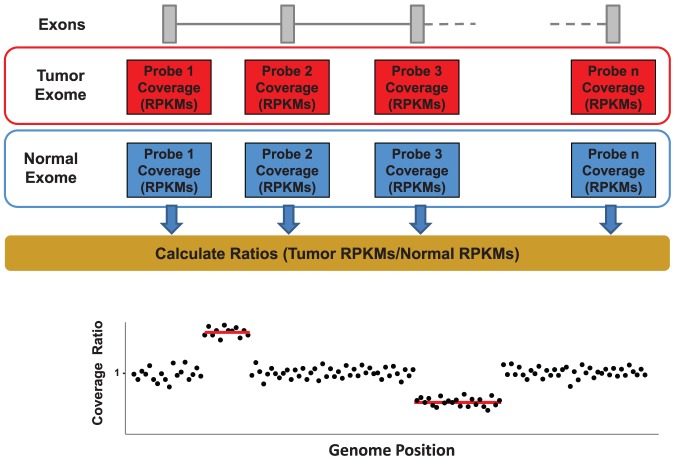
Figure 2. Scheme depicting the strategy used by exome2cnv for detecting CNAs using exome coverage data for a tumor sample and a normal sample from the same patient.
Normalized coverage (RPKMs) is determined for each individual capturing exon, and the ratio tumor/normal is calculated for each probe. Genome-wide analysis of ratios allows the identification of regions having somatic copy number alterations in the tumor (red lines).

