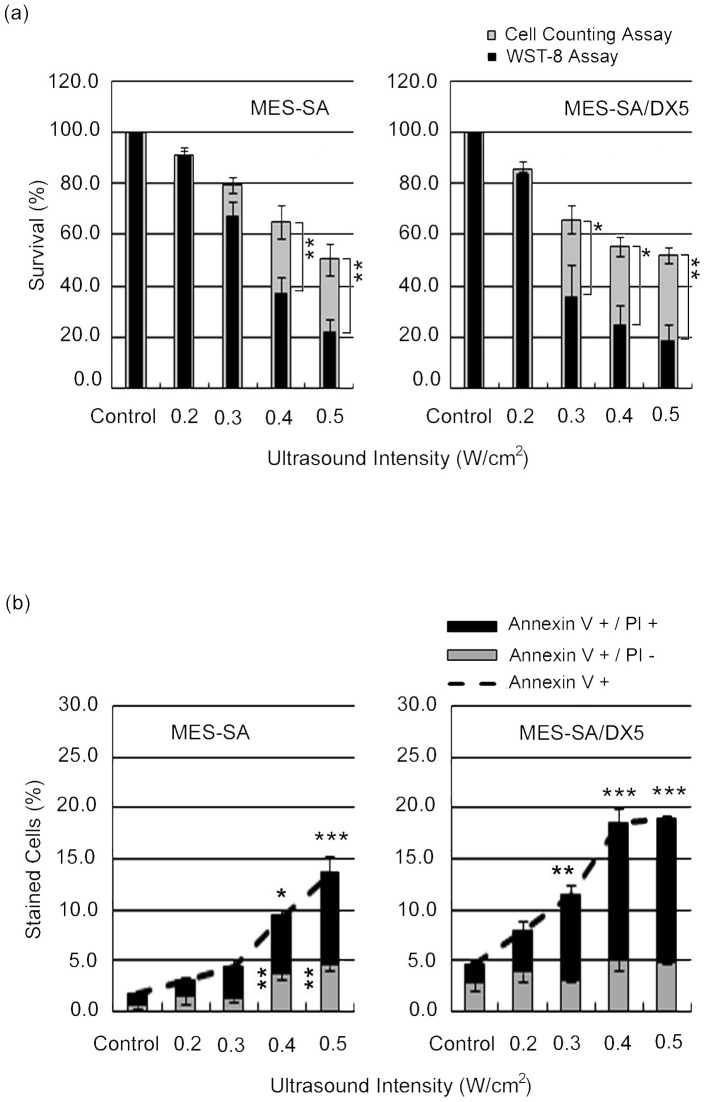
Figure 1. Ultrasound-induced cell killing in MES-SA and MES-SA/DX5 cells 24 hr post exposure to different acoustic intensities.
(a) Cell viability assessed by WST-8 and cell counting assay. Asterisks (*) indicate the statistical significance of the difference between the absolute percentages obtained from WST-8 and cell counting assays at one intensity for one cell line. (b) Flow cytometric analyses for FITC-labelled Annexin V and PI staining. Vertically-aligned asterisks indicate the statistical significance of Annexin V (+)/PI (−) cells, whereas horizontally-aligned asterisks indicate the statistical significance of Annexin V (+)/PI (+) cells in comparison to control. Data points are presented as mean ± SEM.

