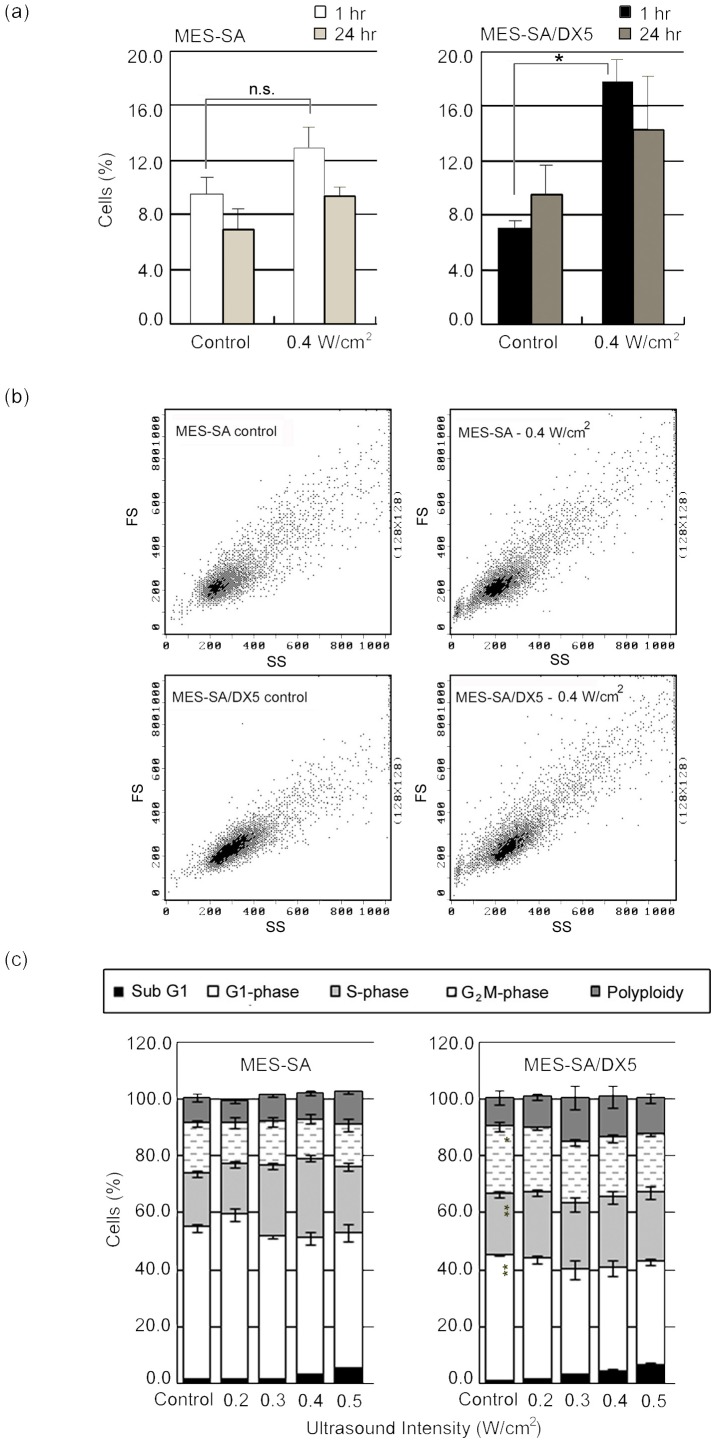
Figure 5. Cell cycle analysis of MES-SA and MES-SA/DX5 cells.
(a) The fraction of polyploid cells detected 1 hr and 24 hr after sonication at 0.4 W/cm2. Data points are presented as mean ± SEM. Asterisks (*) denote statistical significance. (b) Flow cytometric dot plots of forward (y-axis; FS) versus side (x-axis; SS) scatter parameters showing the increase in cell size of MES-SA/DX5 cells 1 hr post sonication at 0.4 W/cm2. (c) Cell cycle analysis performed 24 hr post sonication at different intensities.

