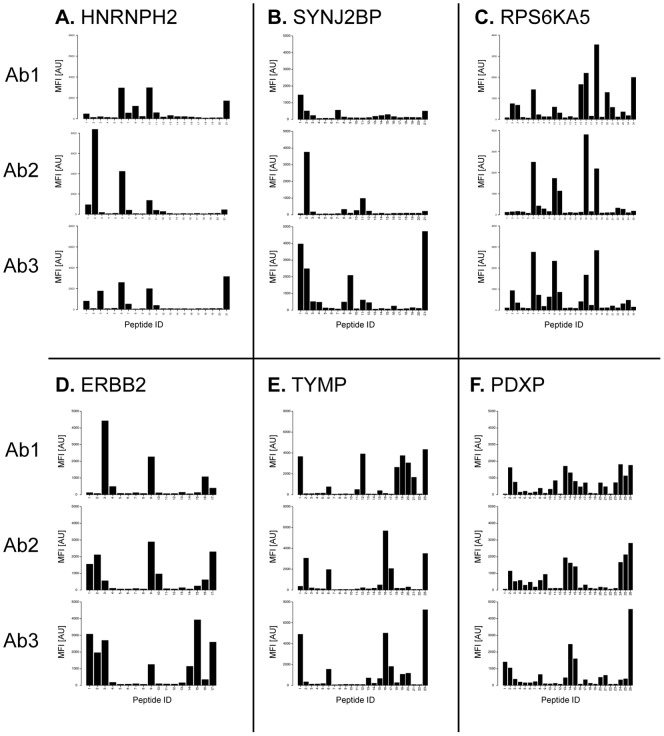
Figure 3. Epitope mapping of antibodies using peptide suspension bead arrays.
Six different peptide arrays (A–F) were used for mapping three antibodies each (Ab1–Ab3) generated in separate animals. For each target protein, binding profiles of 15-mer peptides with a 10 amino acid overlap, are aligned on top of each other. The x-axis indicates the peptide ID and the y-axis indicates the mean fluorescence intensity (MFI).

