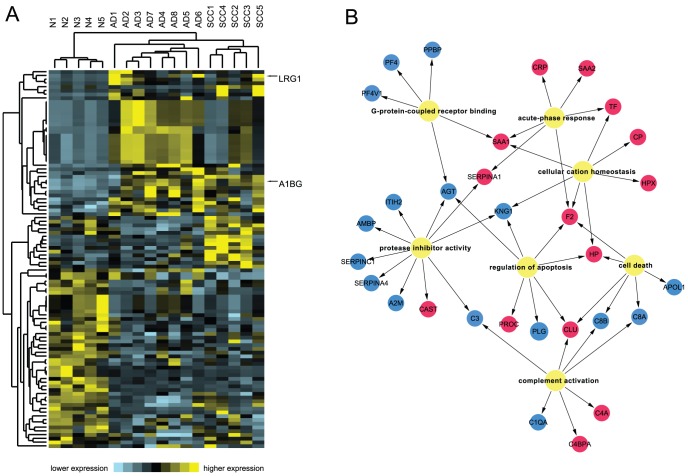
Figure 3. A high quality serum proteome associated with NSCLC.
(A) Hierarchical clustering heatmap of 101 significantly altered proteins. Expression values are shown as a color scale with higher values represented by yellow and lower represented by blue. (B) Gene Ontology biological processes significantly enriched in 101 protein set. Gene symbols in blue or red circles (could be referred in Table S3) indicate the corresponding proteins in down- or up-regulated in NSCLC sera.

