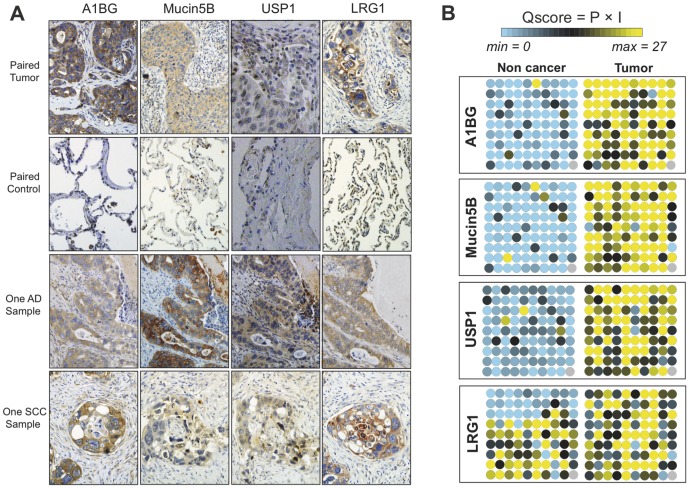
Figure 4. TMA assisted validation for histological biomarkers.
(A) Representative IHC cases with higher expression level in NSCLC sections. One SCC and one AD sample are shown to suggest different Q scores can be obtained by the four proteins; magnification 200×. (B) Virtual result of TMA. Q scores are calculated considering both percentage of positive cells and stain intensity and shown as a color scale with higher Q represented by yellow (maximum = 27) and lower Q represented by blue (minimum = 0). The grey spot represents the only one case lost during the processing.

