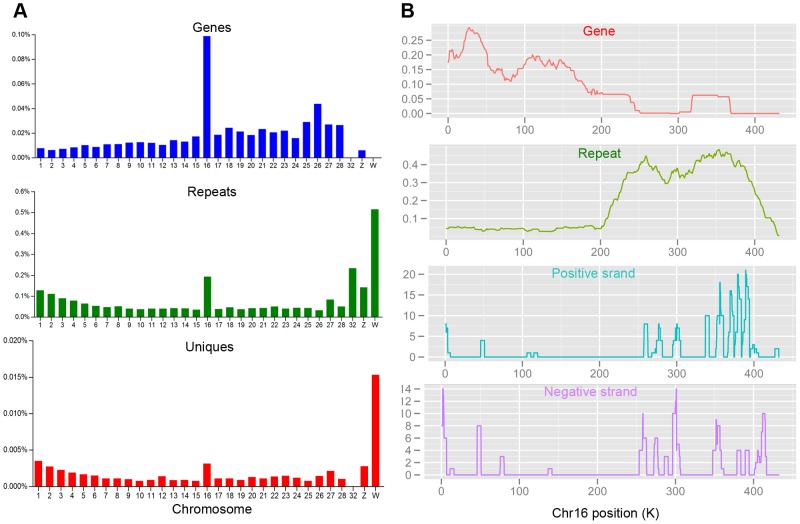
Figure 4. Properties of unannotated unique reads in the testis.
A: Chromosomal distribution of exons (top), repeat sequences (middle) and unannotated unique reads (bottom). The number of bases in exons of Refseq genes and repeats are plotted as a percentage of overall chromosome length. The numbers of piRNAs are normalized to chromosome length and plotted. B: Density analysis of exons (red), repeat sequences (green) and unannotated unique reads (with the positive strand in blue and the negative strand in purple) along chromosome 16. The densities of exons and repeats were using a 50 kB window, scanning the genome in increments of 1000 bases. Unannotaed uniques densities were determined by calculating a moving average of reads in a 5 kB sliding window (100 base increments) along each chromosome. Only reads that map 1 to 5 times to the genome were used in density analysis.

