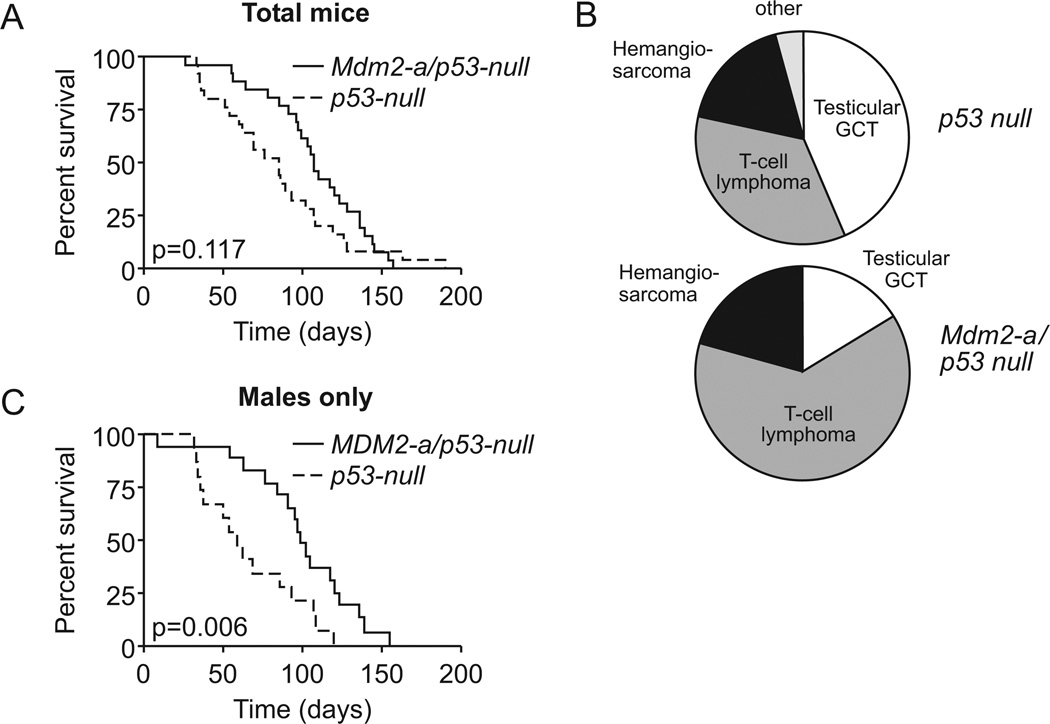
Figure 5. MDM2-A does not significantly alter the survival of p53-null mice, but does shift the tumor spectrum.
(A) Kaplan-Meier survival curve of p53-null (dashed line) and Mdm2-a/p53 null (solid line). There was no significant different in survival between the two groups (p=0.117). (B) Tumor spectrum of p53-null (upper) and Mdm2-a/p53-null (lower). GCT; Germ cell tumor. There was a marginal significant difference in the tumor spectrum between the two groups (p=0.086). (C) Kaplan-Meier survival curve of males only, p53-null (dashed line) and Mdm2-a/p53-null (solid line). There was a significant difference between the two populations once the male mice were evaluated separately (p=0.006).

