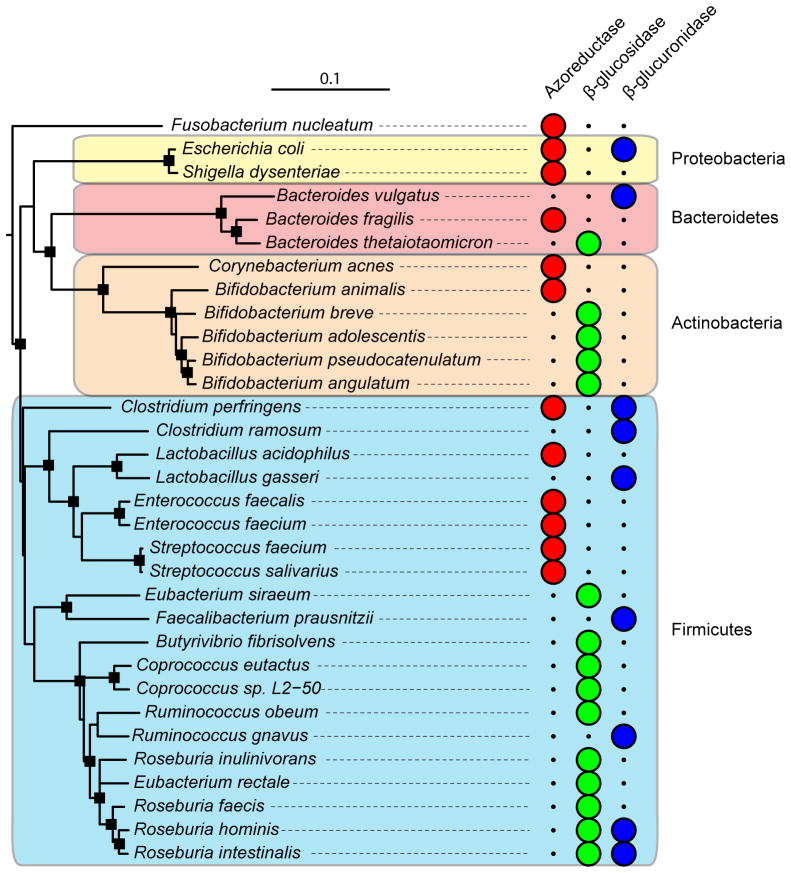
Figure 1. Phylogenetic distribution of cultured gut isolates with enzymatic activities relevant to xenobiotic metabolism.
Full-length aligned 16S rRNA gene sequences for bacteria of interest were retrieved from the Ribosomal Database Project website (Release 10, update 29) [99]. The “Tree Builder” tool was used with Fusobacterium nucleatum as the outgroup. The resulting tree was exported in Newick format and annotated using the Interactive Tree of Life website [100]. Major bacterial phyla are shown in colored boxes: Actinobacteria (orange), Bacteroidetes (red), Firmicutes (blue), and Proteobacteria (yellow). Large circles indicate the presence of a confirmed enzymatic activity within each bacterial species. Nodes with a bootstrap value >70 are indicated by black squares.

