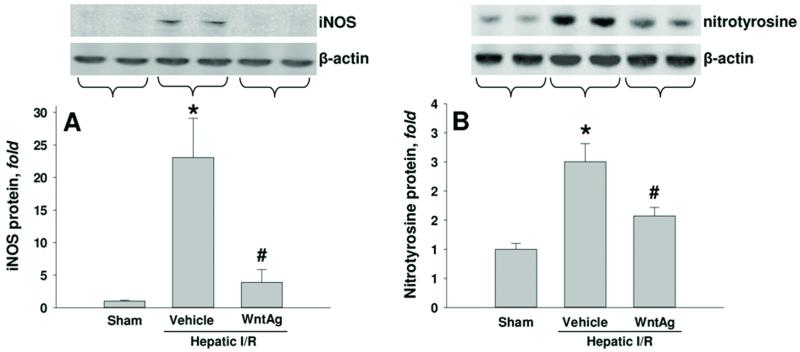
Fig. 5. Effect of Wnt agonist on iNOS and nitrotyrosine expression after hepatic I/R.
Liver tissues were harvested 24 h after reperfusion from the sham, vehicle, and Wnt agonist-treated (WntAg) groups. Total cell lysate were subjected to Western blotting. Representative blots against (A) iNOS and corresponding β-actin (B) nitrotyrosine and corresponding β-actin are shown. Blots were scanned and quantified with densitometry. Band intensity of iNOS or nitrotyrosine was normalized to the corresponding band intensity of β-actin. Data presented as means ± SE (n=4-6/group) and compared by one-way ANOVA and SNK method;*P > 0.05 vs. Sham; #P > 0.05 vs. Vehicle.

