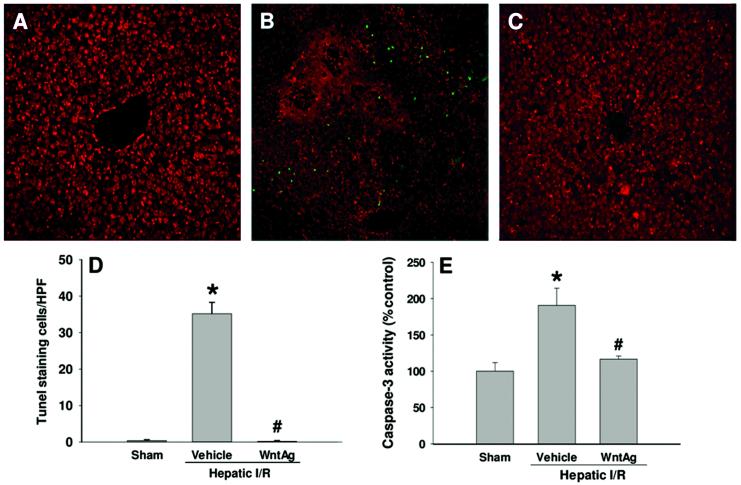
Fig. 7. Effect of Wnt agonist on induction of apoptosis after hepatic I/R.
Liver tissues were harvested 24 h after reperfusion. (A-C) Liver sections were subjected to TUNEL assay to detect DNA fragmentation. Representative images for sham (A), vehicle (B), and Wnt agonist-treated (C, WntAg) groups. Green, TUNEL positive and red, propidium iodide staining for nucleus. (D) A graphical representation of TUNEL positive staining cells averaged over 10 microscopic fields/animal. (E) Liver tissue caspase-3 activity was measured by a fluorometric assay. Data presented as means ± SE (n=4-6/group) and compared by one-way ANOVA and SNK method;*P > 0.05 vs. Sham; #P > 0.05 vs. Vehicle.

