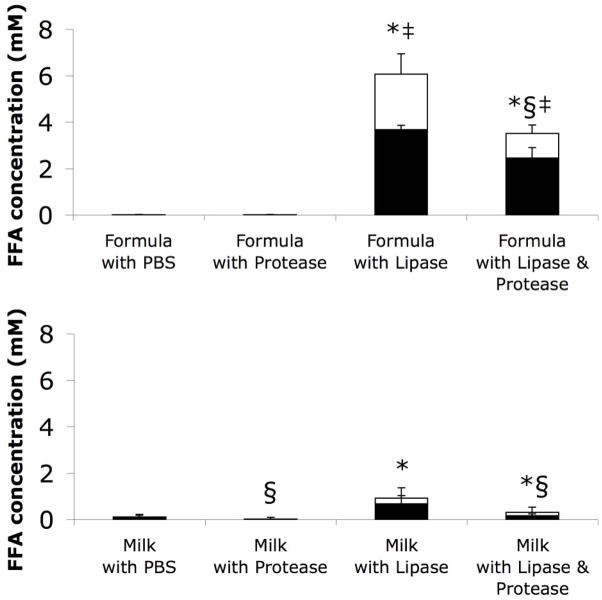
Figure 4.
Total (full columns) and bound (black portion of columns) FFA concentrations in (top) formula or (bottom) milk after digestion and subsequent skimming (i.e. aliquots of the same solutions tested for cytotoxicity in Figure 1, frozen at −80 °C until FFA concentration analysis). The differences between the total and bound FFAs (white portion of columns) represent the concentrations of unbound FFAs. Significances shown in the figure refer only to total FFA levels. The interactions in the two-factor MANOVAs (food source – between subjects; digestion type – within subjects) for total and unbound FFA concentrations were significant (both P<0.05, ηp2=0.95 for total FFAs, ηp2=0.79 for unbound FFAs); P<0.017 considered significant for pair-wise comparisons. * P<6×10⁻⁴ in total FFA with versus without lipase digestion. ‡ P<3×10⁻⁴ in total FFA in formula group versus equivalent milk group. § significant (P<0.009) decrease in total FFA with protease digestion. N=12 for milk and 5 for formula. Significant differences in unbound FFAs were identical to those of total FFAs, with the following exceptions: unbound FFAs in milk digested with lipase and protease were not quite significantly higher than if digested with protease alone (P=0.019); unbound FFAs were not significantly reduced with protease digestion (P=0.035 for formula with lipase and protease versus with lipase only).

