Figure 1.
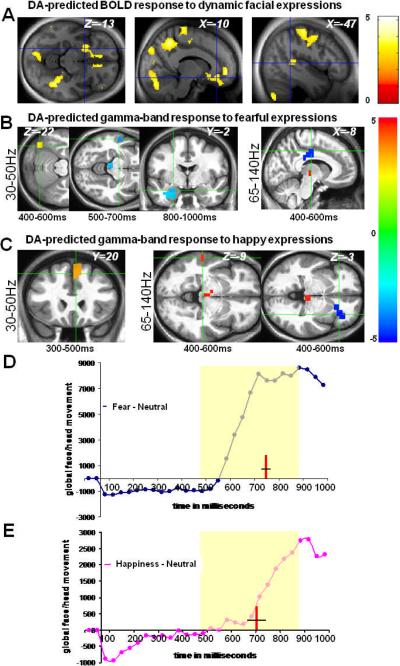
Neural correlates of emotional salience as predicted by midbrain presynaptic dopamine synthesis and tone. A, correlations in sensorimotor and frontolimbic regions between midbrain FDOPA Ki and BOLD response to videos of dynamic facial expressions independent of valence (p<.001) B, for fearful expressions: correlation between FDOPA Ki and low-[30–50Hz] and high-[65–140Hz] GBA and the corresponding time windows within which these responses survived p<0.001 statistical thresholds. C, for happy expressions: correlation between FDOPA Ki and low and high GBA. X,Y,Z values represents MNI coordinates; t-values for the resulting maps in A, B & C are shown on the color bars. Blue clusters represent regions showing negative correlations between GBA and FDOPA measures, whereas red clusters represents positive correlations between GBA and FDOPA measures. D, E timecourses of behaviorally validated facial expressions of fear and happiness15, relative to neutral assessed with the PerceptualDiff software; red lines and black crossing lines within the yellow shaded areas in D & E indicate the points in time (mean ±SEM, in milliseconds) of subjective recognition of fear (757.42ms ±14.27) and happiness (709.93ms ±45.14), respectively (see supporting online information).

