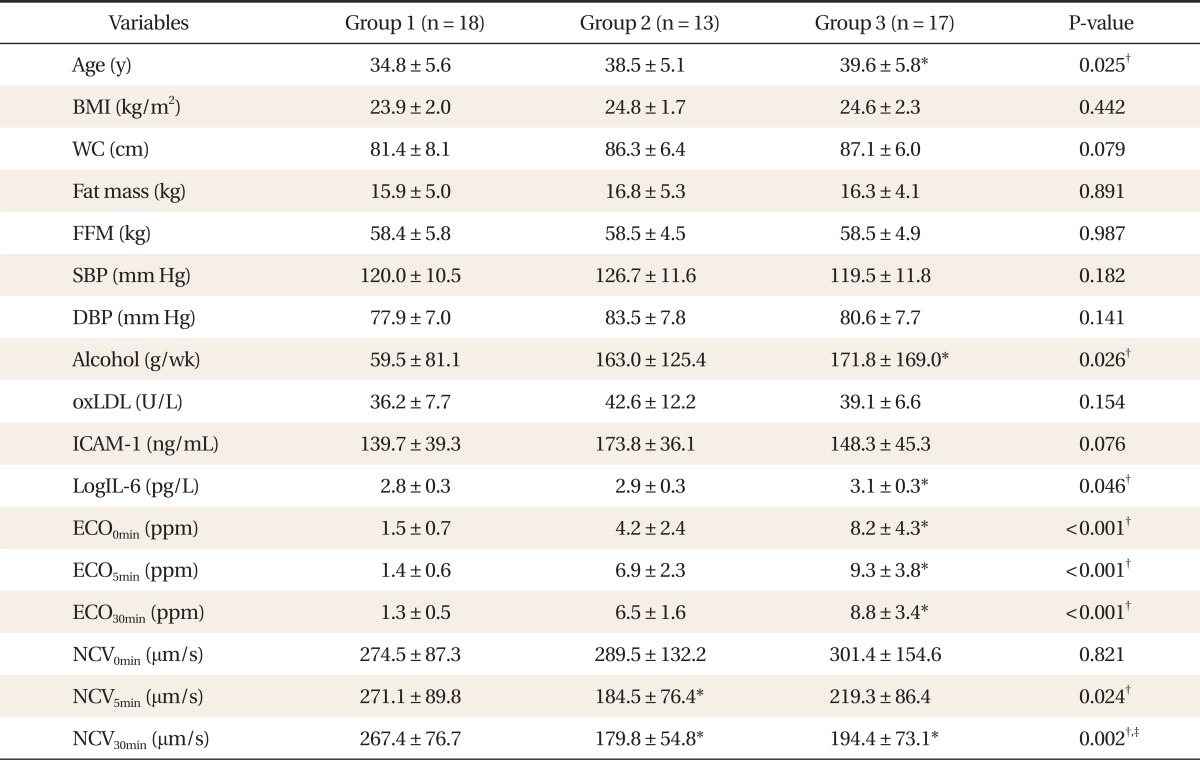
Table 5.
Comparison of variables in the groups divided by smoking status.
Values are presented as mean ± SD. P-values were from analysis of variance test. G1: non-smoking group, G2: less than 10 years of total pack-years + less than one pack of daily smoking and more than 10 years of total pack-years + less than one pack of daily smoking, G3: more than 10 years of total pack-years + more than one pack of daily smoking. BMI was calculated from body weight (kg)/height (m2). Fat mass was analyzed by bio-impedance analysis. Alcohol: average alcohol consumption in a week.
BMI: body mass index, WC: waist circumference, FFM: fat free mass by bio-impedance analysis, SBP: systolic blood pressure, DBP: diastolic blood pressure, oxLDL: oxidized low density lipoprotein, ICAM-1: inter-cellular adhesion molecule-1, IL-6: interleukin-6, ECO0min: concentration of expiratory CO before cigarette smoking detected by micro smokerlyzer, ECO5min: concentration of expiratory CO after 5 minutes of cigarette smoking detected by micro smokerlyzer, ECO30min: concentration of expiratory CO after 30 minutes cigarette smoking detected by micro smokerlyzer, NCV0min: nailfold blood velocity before smoking, NCV5min: nailfold blood velocity after 5 minutes of cigarette smoking, NCV30min: nailfold blood velocity after 30 minutes of cigarette smoking.
*Marked on the value with significance by the comparison with non-smoker in post hoc analysis. †Marked on the P-values with significance by post hoc analysis. ‡Marked on the P-value with significance after age, alcohol consumption, and LogIL-6 adjustment by analysis of covariance test between NCV5min and NCV30min.

