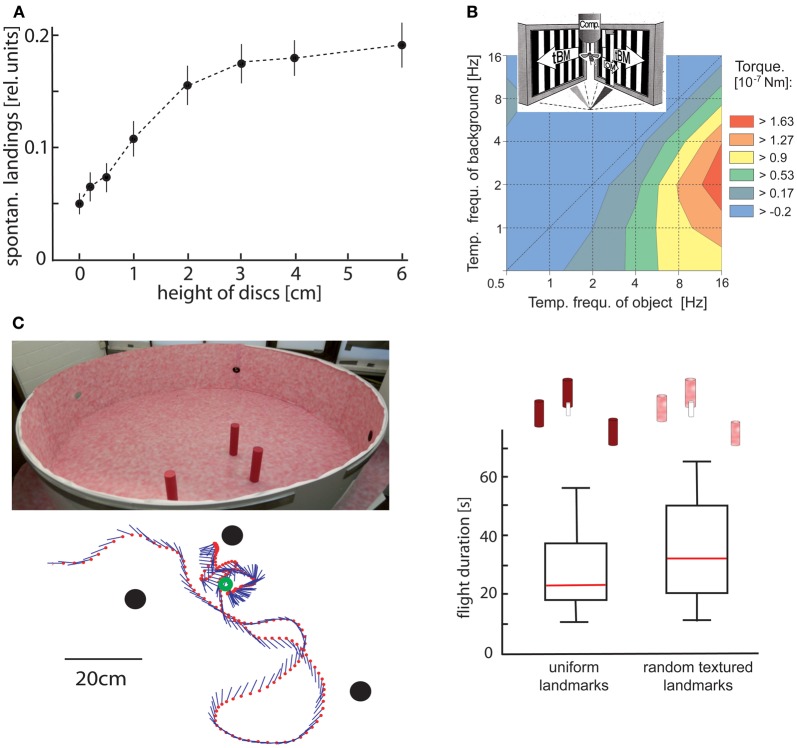
Figure 2.
Object detection by relative motion cues. (A) Relative number of spontaneous landings of free-flying flies on discs covered with a random texture of different heights. The floor and walls of the flight arena were covered with the same texture. Hence, the discs could only be discriminated by relative motion cues induced on the eyes by the self-motion of the animal. Flies landed on discs raised at least 1 cm above the floor significantly more often than on a reference disc on the floor (data from Kimmerle et al., 1996). (B) Contour plot of the turning responses of tethered flying flies measured with a yaw torque compensator (comp) for different combinations of temporal frequencies of object motion (OM) and translatory background motion (tBM). The motion stimuli were striped patterns (spatial period 6.3°) presented on two monitor screens placed at an angle of 90° symmetrically in front of the fly. OM was displayed within a vertical 6.3° wide window in front of the right eye. Object-induced responses are given in a color coded way with warmer colors indicating larger responses. Flies show strong turning responses when OM is faster than tBM. The strongest responses are induced when the background is not stationary, but moves slowly (data from Kimmerle et al., 1997). (C) Landmark navigation of honeybees in a cylindrical flight arena with three cylindrical landmarks (upper left diagram). The landmarks were either homogeneously red or were covered by the same random pattern as the background. Bees were trained to find a barely visible feeder placed between the homogeneous landmarks. The trajectory of one search flight maneuvre is shown in the top view (bottom left diagram). The feeder (green circle) and the landmarks (black dots) are indicated. The position of the bee is indicated by red dots at each 32 ms interval; straight lines represent the orientation of the long axis of the bee. The duration of search flights until landing on the feeder was not significantly increased when the pattern of the landmarks was changed from homogeneous red to the random dot texture that also covered the background (right diagram). Red lines indicate median values, the upper and lower margins of the boxes, the 75th and 25th percentiles; the whiskers indicate the data range (Data from Dittmar et al., 2010).

