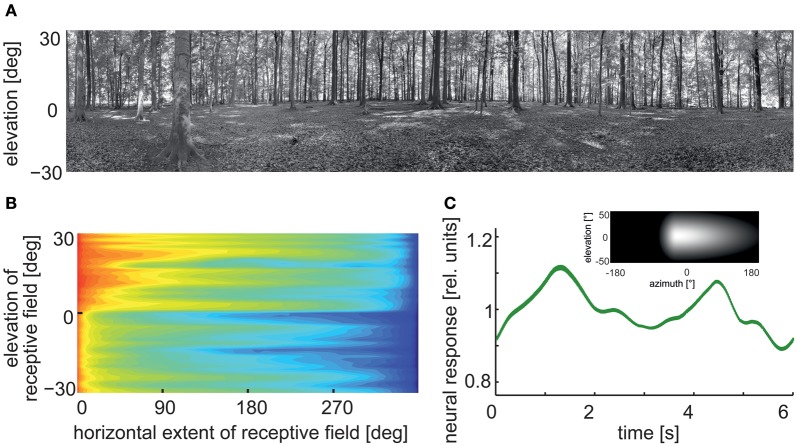
Figure 7.
Pattern-dependent response modulations of modeled arrays of movement detectors. (A) Panoramic high dynamic range image of a forest scene (rescaled in contrast for printing purposes). (B) Logarithmic color-coded standard deviation describing the mean pattern-dependent modulations for one-dimensional receptive fields differing in the elevation of receptor position and azimuthal receptive field size. Pattern-dependent modulations decrease with horizontal receptive field extent. Modulation amplitude depends on the contrast distribution of the input image, as can be seen when comparing pattern-dependent modulation amplitudes corresponding to the upper (trees) and lower part (ground) of the input image. (C) Time-dependent response of an array of movement detectors with an estimated HSE cell receptive field. Inset: Weight field of the spatial sensitivity distribution of a HSE cell. The brighter the gray level, the larger the local sensitivity. The frontal equatorial viewing direction is at 0° azimuth and 0° elevation. Image motion was performed for 12 s in the preferred direction of the model cell at an angular velocity of 60°/s (Data from Meyer et al., 2011).

