Figure 8.
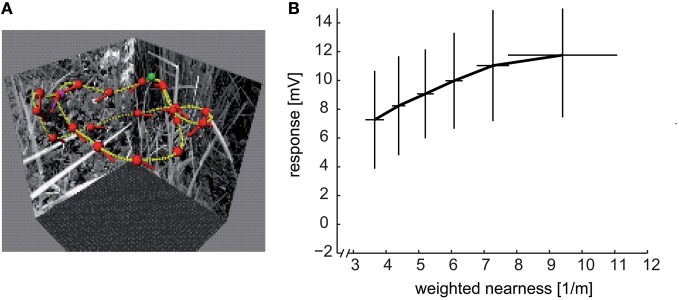
Distance dependence of intersaccadic responses in the HSE cell, a prominent LWC in the blowfly lobula plate. (A) Sample flight trajectory of a blowfly in a cubic arena used for the reconstruction of optic flow. The track of the fly is indicated by the yellow lines; red dots and short dashes indicate the position of the fly's head and its orientation, respectively; green and violet dots indicate the start and end of the trajectory, respectively. (B) Average intersaccadic responses of HSE cell recordings from three different flight trajectories plotted versus the corresponding average weighted nearness. The responses were sorted by increasing nearness and then attributed to six groups. The vertical and horizontal lines show the standard deviations of responses and nearness, respectively, across the data values within one group. The intersaccadic responses were related to the nearness of the fly to the respective arena walls (nearness = 1/distance), weighted by the HSE cell's spatial sensitivity distribution (see inset of Figure 7C). The intersaccadic responses increase with increasing nearness to the walls of the flight arena (Data from Liang et al., 2012).

