
Figure 5.
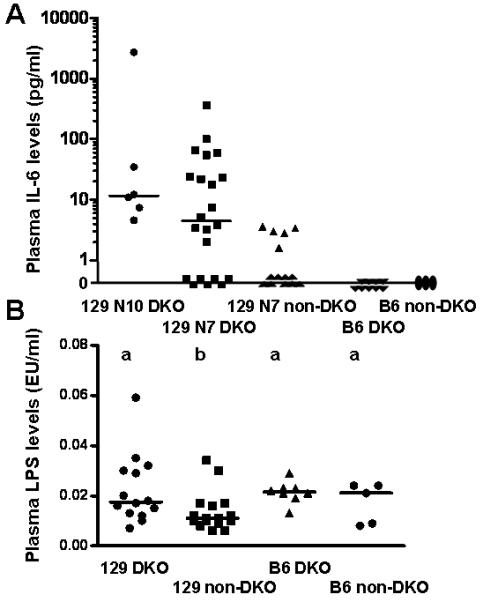
Scatter plots of plasma IL6 and LPS levels. Panel A. Plasma IL-6 levels from GPX1/2-DKO mice at peak of inflammation, i.e. 22-day-old 129 N7 and N10 mice and 50-day-old B6, as well as age-matched non-DKO controls. The number of mice in each group is: 6 for 129 N10 DKO, 22 for 129 N7 DKO, 14 for N7 non-DKO, 9 for B6 DKO and 3 for B6 non-DKO. No set is significantly different from the others. Panel B. Plasma LPS levels detected for the same groups. The levels in the 129 GPX1/2-DKO group are significantly greater than the heterozygous 129 mice but not the B6 groups (P=0.033, t-test). The means that differ are shown as a>b. The Y-axis is Endotoxin Unit/ml, which is generally converted to LPS concentration as 1 EU=100 pg LPS/ml. In both panels, the bars indicate the medians, and each symbol represents a mouse.