
Figure 6.
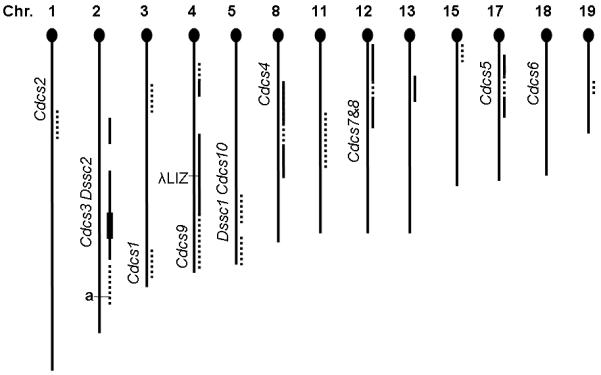
Distribution and incidence of B6 alleles in the 129 N5 cohort, represented by 10 offspring, sampling 5 breeder females and 3 breeder males in comparison with colitogenic loci detected in 2 other studies (complete data in Supplemental Table 1). Chromosomes are listed in order by number and oriented with the telomeric centromere (= 0 Mbp) at the top. The dashed or solid lines to the right of the chromosome stick map indicate loci where B6 alleles were detected in the 129 N5 cohort. Loci with low representation of B6 alleles (1-4 mice; almost all heterozygous) are shown by dashes, and those heavily represented sites (5 or more; some homozygous B6 alleles) shown by solid lines. The left side of the stick map is marked with the location of Cdcs (Cytokine-deficiency-induced colitis susceptibility) and Dssc (Dextran-sodium-sulfate colitis) loci along with the non-agouti gene and the λLIZ transgene. The chromosome 2 B6 loci (solid line) in 129 N5 were detected in 7-8 mice with 1-4 homozygous B6 (4 at 119 Mbp, thickened line). This analysis was based on the GWAS performed on the first set of 129 N5 mice (Supplemental Table 1), thus did not include the new loci on Chromosome 1 and 3 identified in 129 N7 mice (Supplemental Table 2).