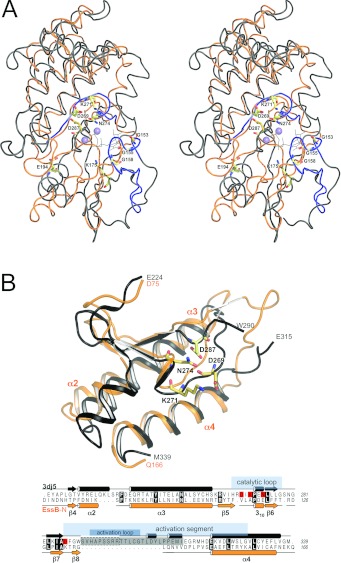
Figure 4. Comparison with kinases.
(A) Stereo view of rigid body superimposition of EssB-N (orange) and Aurora-A kinase catalytic domain (grey) is depicted in ribbon representation. Prosite serine/threonine protein kinase signature motifs PS00107 ([LIV]-G-{P}-G-{P}-[FYWMGSTNH]-[SGA]-{PW}-[LIVCAT]-{PD}-x-[GSTACLIVMFY]-x(5,18)-[LIVMFYWCSTAR]-[AIVP]-[LIVMFAGCKR]-K) and PS00108 ([LIVMFYC]-x-[HY]-x-D-[LIVMFY]-K-x(2)-N-[LIVMFYCT](3)) are highlighted in black. Highly conserved serine/threonine kinase residues are drawn as sticks. ATP (shown as black lines) and two Mn2+ ions (lilac spheres) were modelled by superimposition of the ATP-bound structure of protein kinase A (PDB code 1ATP). (B) View of the C-terminal side of the cleft, which features the highest degree of structural similarity. A partial structural alignment over 86 residues (EssB Asp75–Gln166 and Aurora-A kinase Glu224–M339) is shown. Aurora-A kinase invariant active-site residues Asp269, Lys271 and Asn274, and the activation segment residue Asp287 are in sticks and highlighted in red in the underlying sequence alignment. Aurora-A kinase residues Ser291–Glu315 (grey box in the sequence alignment), including seven residues of the activation loop, which is not resolved in the structure (boxed in a broken line), have been omitted for clarity. Secondary structure elements and known functional serine/threonine protein-kinase segments deduced from [47] are indicated.

