
FIG. 15.
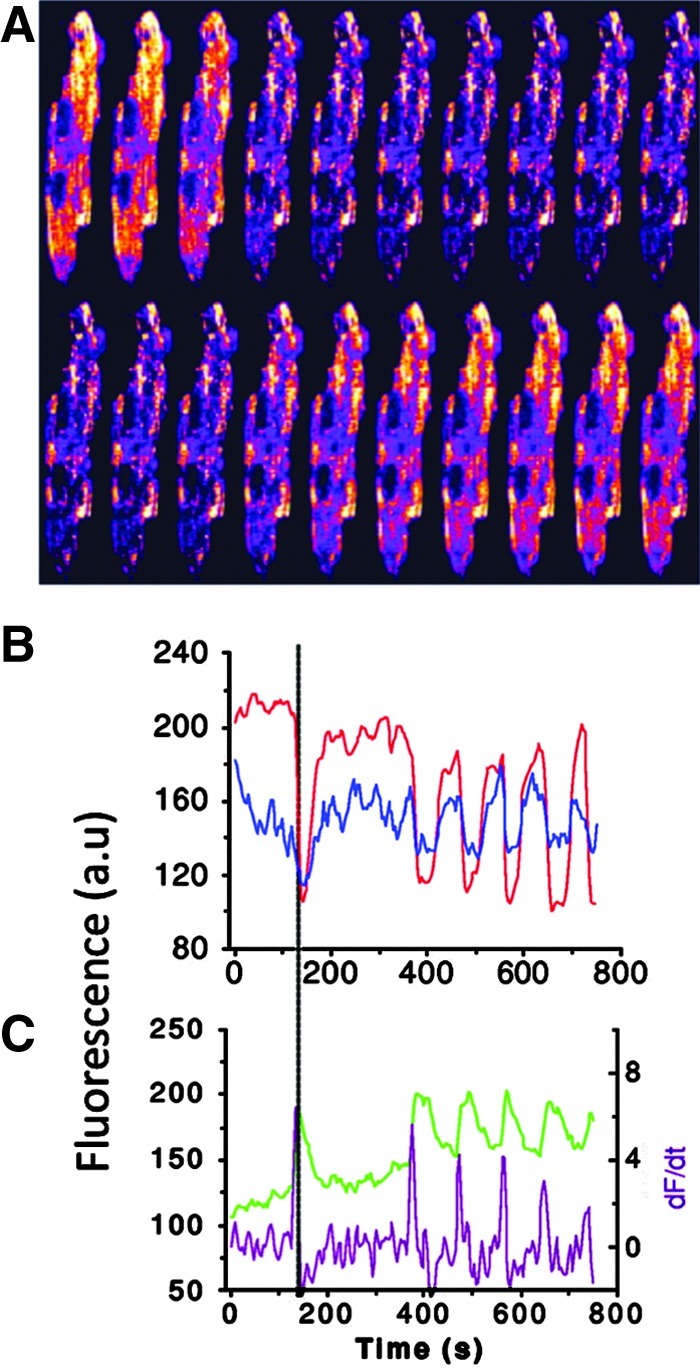
Characterization of cell-wide mitochondrial oscillations. (A) Images of a cardiomyocyte loaded with TMRE (for detection of mitochondrial membrane potential) and DCF (for detection of ROS generation at the frame interval of 7 s. The phasic increase in intensity of fluorescence is evident. (B) Time course of average whole-cell fluorescence of TMRE and NADH (as an indicator of ROS), and (C) DCF and the derivative of DCF signals (dF/dt, purple). The precise phase relationship between all signals can be clearly appreciated from the vertical reference line drawn in (B, C). The individual panels in the figure were originally published in Aon et al. (11) © The American Society for Biochemistry and Molecular Biology. Reprinted with permission.