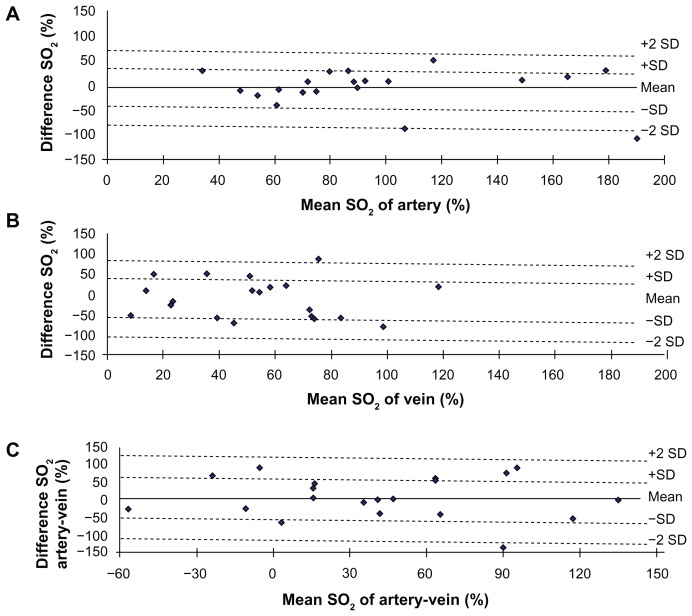
Figure 3.
Bland-Altman plot of the difference between two measurements. The plots of mean artery SO2 (A), vein SO2 (B), and artery-vein SO2 (C) against differences in optical density ratio obtained during two sessions of SO2 measurements in 20 healthy subjects.
Note: Solid lines and dashed lines indicate mean differences and 95% limits of agreement.
Abbreviations: SO2, oxygen saturation; SD, standard deviation.

