
Figure 4.
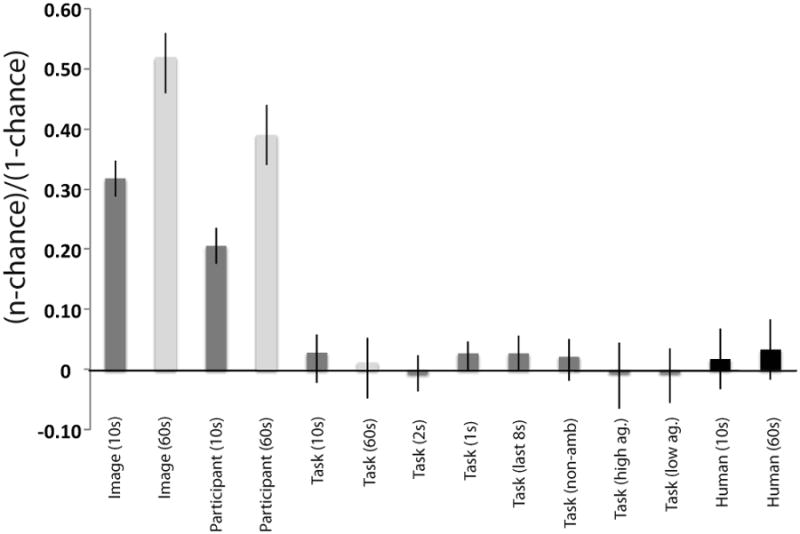
Overall performance of classifiers and human observers on predicting viewer, image and task. Error bars represent 95% confidence intervals on the binomial test using the procedure described in Clopper & Pearson (1934). The y-axis ranges from 0 (chance) to 1 (perfect classification).