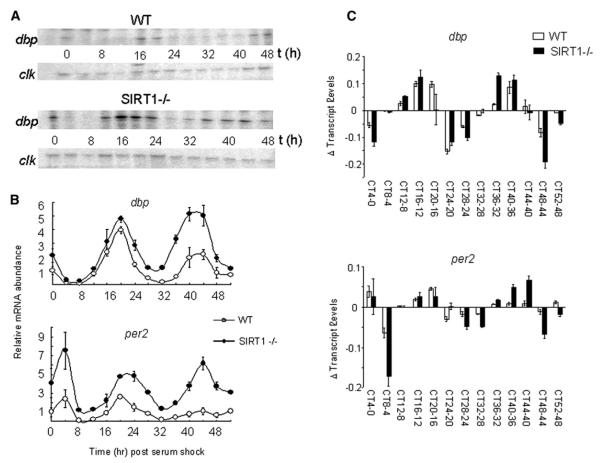
Figure 2. SIRT1 Regulates Circadian mRNA Expression of dbp and per2 Genes.
(A) dbp and clock mRNA expression levels in wild-type (WT) and Sirt1 null (Sirt1−/−) MEFs after serum shock were examined by RNase protection assay. Representative results are shown and experiments were done using four independent samples.
(B) dbp and per2 mRNA expression profiles in WT and Sirt1−/− MEFs after serum shock were analyzed by quantitative PCR. Time 0 value in WT MEF for each gene was set to 1. All data presented are the means ± SEM of three independent samples.
(C) Relative increment/decrement of dbp and per2 gene expression. Plus values on vertical lines mean increment and minus values on vertical lines indicate decrement.

