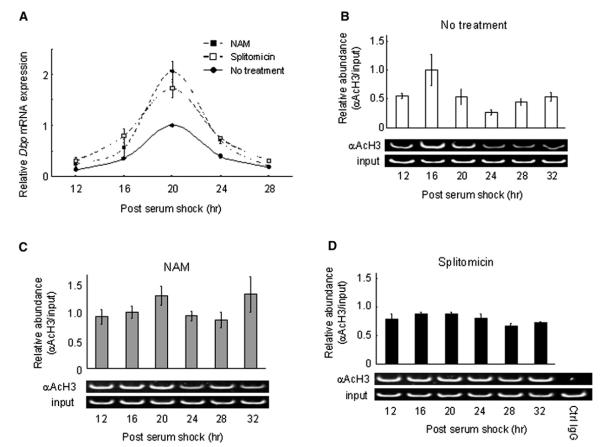
Figure 3. Circadian Histone H3 (Lys9/Lys14) Acetylation at dbp TSS Is Dependent on SIRT1 Activity.
(A) Dbp expression levels in MEFs either treated with SIRT1 inhibitors (10 mM NAM or 120 mM splitomicin) or not were analyzed by quantitative PCR. The value at time 20 in MEFs without treatment was set to 1.
(B–D) Crosslinked cell extracts were isolated from MEF without treatment (B) or with SIRT1 inhibitors, 10 mM NAM (C), or 120 mM splitomicin (D) at indicated time points after serum shock, subjected to ChIP assay, and analyzed by quantitative PCR with dbp TSS primers (See Figure 4C). Results of semiquantitative PCR are also shown at the bottom of each experiment. The value at time 16 in MEFs without treatment was set to 1. All data presented are the means ± SEM of three independent samples.

