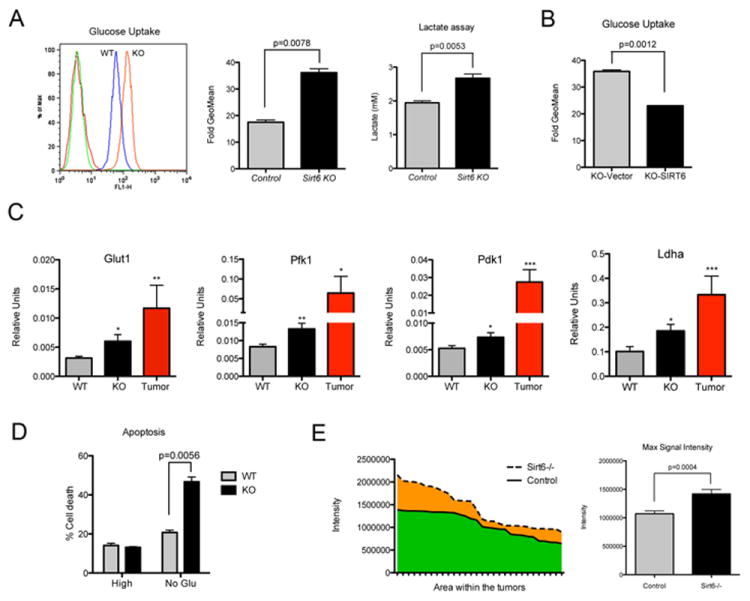
Figure 2. SIRT6 deficient cells and tumors exhibit enhanced aerobic glycolysis.

A) Glucose uptake (left and middle panels) and lactate production (right panel) of Sirt6 WT and Sirt6 KO immortalized MEFs (two independent cell lines, error bars indicate SEM). B) Glucose uptake of Sirt6 KO immortalized MEFs transduced with either an empty vector or a plasmid encoding for Flag-SIRT6 (error bars indicate SD). C) Real-Time PCR showing the expression of the indicated genes in Sirt6 WT and Sirt6 KO (n=20 experiments from two independent lines) immortalized MEFs and in the cells derived from Sirt6 KO tumors (n=8 experiments from three independent lines) (error bars indicate SEM). D) The same cells as in A were cultured with or without glucose for 6 days and cell death assayed by AnnexinV staining (error bars indicate SEM). E) 18FDG-Glucose uptake in Sirt6 WT and KO H-RasV12/shp53 tumors. Left panel shows FDG-PET intensity of the 5 sections of each tumor (total of 6 tumors for each genotype) showing the highest intensity. Right panel shows the average of 30 FDG-PET signals (6 tumors, 5 sections per tumor) for the indicated genotypes (error bars indicate SD). See also Figure S2.
