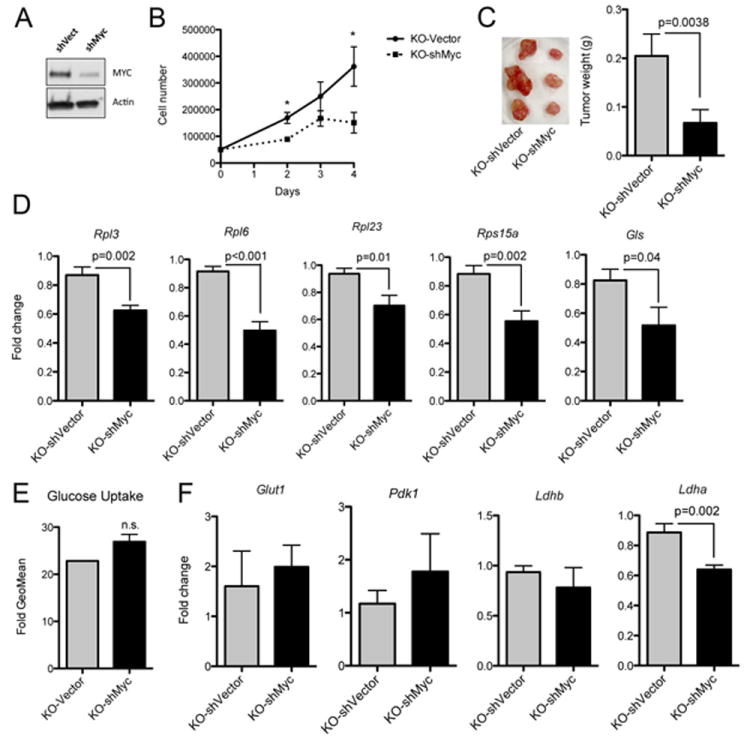
Figure 5. MYC regulates tumor growth of SIRT6-deficient cells.

A) Western blot showing MYC levels in Sirt6 KO-shVector and shMYC cells. B) 5×10⁵ MEFs were plated in triplicate and cells counted at the indicated time points (error bars indicate SD). C) 5×10⁶ cells of the indicated genotypes were injected into SCID mice and the tumors harvested and weighted (error bars indicate SD). D) Expression of the indicated genes in Sirt6 KO-shVector and KO-shMYC cells (n=9) (error bars indicate SEM). E) Glucose uptake was analyzed in the same cells as in A (error bars indicate SD). F) The same samples as in D were used to analyze the expression of the indicated genes (error bars indicate SEM). See also Figure S5.
