Figure 2.
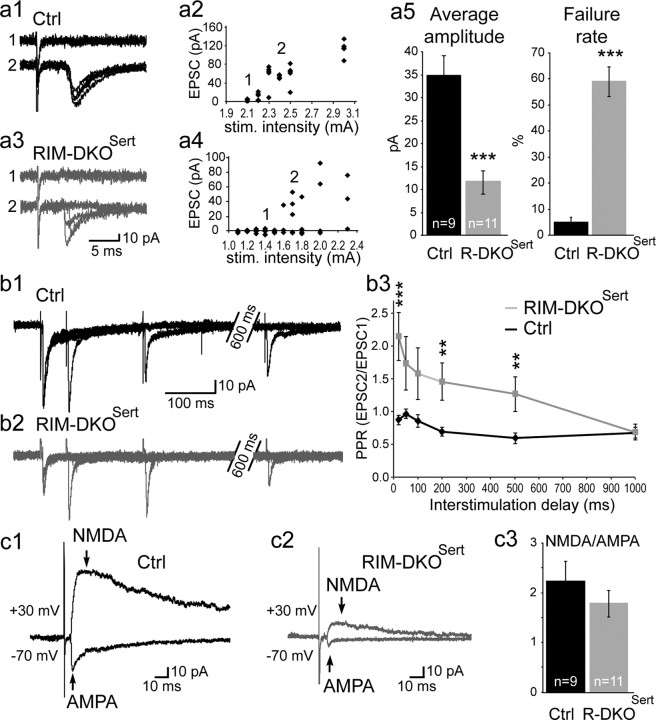
Reduction of the TC synaptic transmission in the RIM-DKOSert mice. The TC synapses were analyzed in P5 to P7 brain slices preserving the TC pathway. TC axons were stimulated at low frequency (0.03 Hz) in the internal capsule and the TC EPSCs were recorded in layer IV neurons. a1, a3, Superimposed individual responses show failures (1) and single afferent fiber EPSC (2) in control (a1) and RIM-DKOSert (a3) mice. a2, a4, The peak amplitude of the AMPA component of the evoked TC EPSC is plotted against the IC stimulation intensity for the same recordings in control (a2) and RIM-DKOSert (a4) mice. This curve was plotted for every recording to find out the stimulation intensity needed to record a single afferent fiber unitary EPSC, that is 2.4 mA in control and 1.7 mA in RIM-DKOSert mice. a5, Summary data (mean ± SEM) showing a 60% reduction of the evoked TC unitary EPSC amplitude in the RIM-DKOSert (n = 11; gray) compared with control (n = 9; black) mice. The amplitude of the unitary EPSC includes the failures. The reduction of the unitary EPSC is associated with an increase of the failure rate (*** p < 0.001). b1, b2, Paired-pulse stimulation experiments at various intervals (0.05 s, 0.2 s, 1 s) showed paired pulse depression of the TC EPSCs in control (b1) and paired pulse facilitation in RIM-DKOSert (b2) mice. b3, Summary data of the paired-pulse ratio at various intervals (0.05 s, 0.1 s, 0.2 s, 0.5 s, 1 s) in control (n = 9, black curve) and RIM-DKOSert (n = 11, gray curve) mice. c1, c2, The amplitude of the AMPA and NMDA components of the TC EPSC were obtained by recording EPSC at −70 mV and +30 mV in control (c1) and RIM-DKOSert (c2) mice. c3, This NMDA/AMPA ratio was found similar in control (2.22 ± 0.37, n = 9) and RIM-DKOSert (1.77 ± 0.27, n = 11) mice.

