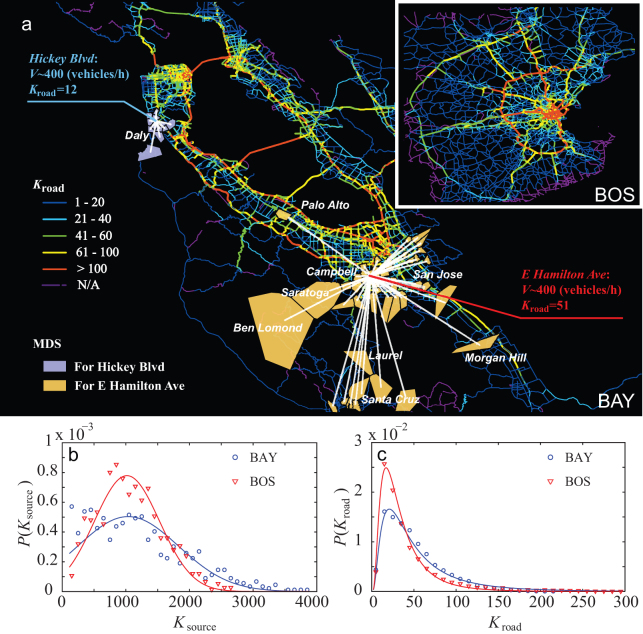
Figure 2. Tracing driver sources via the road usage network.
(a) The colour of a road segment represents its degree Kroad. Most residential roads are found to have small Kroad, whereas the backbone highways and the downtown arterial roads are shown to have large Kroad. The light blue polygons and the light orange polygons pinpoint the MDS for Hickey Blvd and E Hamilton Ave respectively. The white lines show the links that connect the selected road segment and its MDS. The two road segments have a similar traffic flow V ~400 (vehicles/hour), however, Hickey Blvd only has 12 MDS located nearby, whereas E Hamilton Ave has 51 MDS, not only located in the vicinity of Campbell City, but also located in a few distant regions pinpointed by our methodology. (b) The degree distribution of driver sources can be approximated by a normal distribution  with µsource = 1,035.9 (1,017.7), σsource = 792.2 (512.3), R2 = 0.78 (0.91) for Bay Area (Boston Area). (c) The degree distribution of road segments is approximated by a log-normal distribution
  with µroad = 3.71 (3.36) , σroad = 0.82 (0.72), R2 = 0.98 (0.99) for Bay Area (Boston Area). For more statistical analysis of the fits, see SI section III.B.

