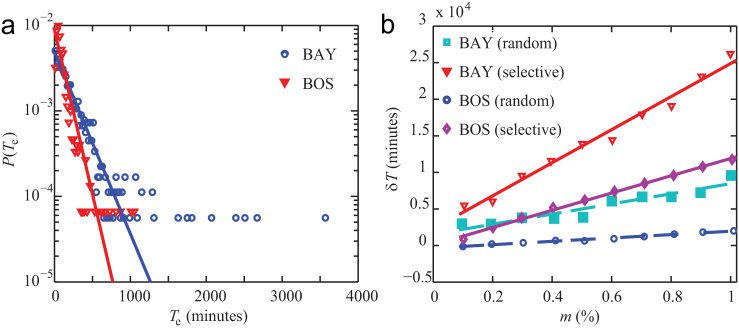
Figure 4. A selective strategy based on the framework of road usage network shows better efficiency in mitigating traffic congestion.
(a) The distribution of the additional time Te for each driver source is well approximated with an exponential distribution  . Te is unevenly distributed in the two urban areas (also see Fig. S17). The maximum Te (Bay Area 3,562 minutes and Boston Area 1,037 minutes) is significantly larger than the average Te (204 minutes and 113 minutes respectively). (b) The total additional travel time reduction δT according to the trip reduction percentage m for the selective vs. the random strategy. The fits correspond to δT = k(m – b), where k is the slope of the linear fit, b is close to zero for all fits. For a detailed statistical analysis of the fits, see the discussion in SI section III.B.

