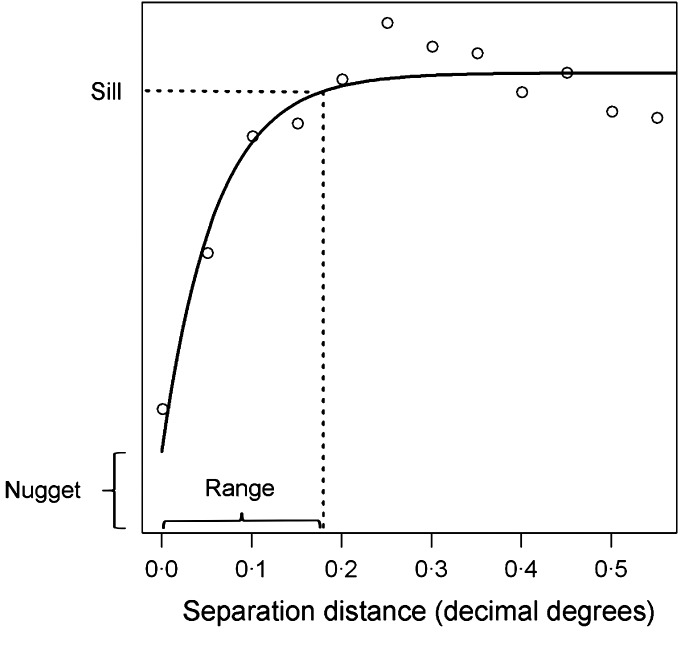
Fig. 2.
An example of a semi-variogram, showing its major components. The range represents the separation distance, at which 95% of sill variance is reached, and here is approximately 20 km. The nugget represents the stochastic variation between points, measurement error or spatial autocorrelation over distances smaller than those represented in the data. Data are from a school-based survey of blood in urine indicative of genitourinary schistosomiasis from Coast province, Kenya (Kihara et al. 2011) and were de-trended (i.e. first order spatial structure was removed) using a quadratic trend surface.

