Abstract
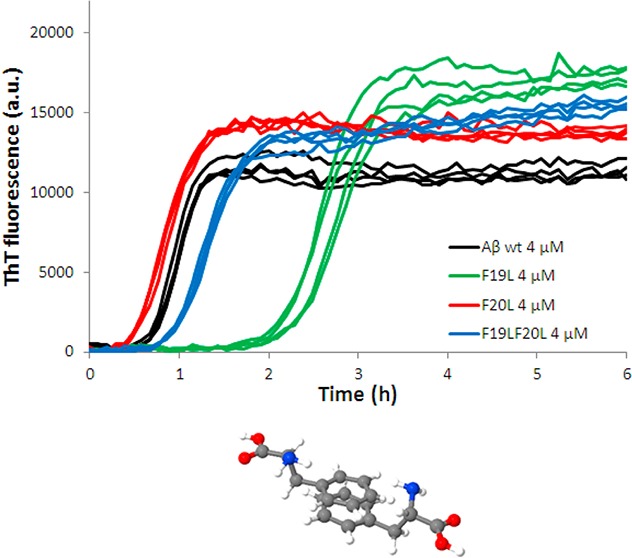
Aggregation of the amyloid β-protein (Aβ) is believed to be involved in Alzheimer’s disease pathogenesis. Here we have investigated the importance of the aromatic rings at positions 19 and 20 for the aggregation rate and mechanism by substituting phenylalanine with leucine. Aggregation kinetics were monitored as a function of time and peptide concentration by thioflavin T (ThT) fluorescence, the aggregation equilibrium by sedimentation assay, structural changes using circular dichroism spectroscopy and the presence of fibrillar material was detected with cryo-transmission electron microscopy. All peptides convert from monomer to amyloid fibrils in a concentration-dependent manner. Substituting F19 with leucine results in a peptide that aggregates significantly slower than the wild type, while substitution of F20 produces a peptide that aggregates faster. The effects of the two substitutions are additive, since simultaneous substitution of F19 and F20 produces a peptide with aggregation kinetics intermediate between F19L and F20L. Our results suggest that the aromatic side-chain of F19 favors nucleation of the aggregation process and may be an important target for therapeutic intervention.
Keywords: Amyloid, aggregation, kinetics, π-stacking, phenylalanine, Alzheimer's
Alzheimer’s disease (AD) is a devastating dementia for which there are no preventive, disease-modifying, or curative treatments.1 Several theories on the pathogenesis of the disease have emerged. Of these, the amyloid cascade hypothesis2,3 appears to best explain what we know about the pathogenic process,4 central to which is the self-assembly of the amyloid β-protein (Aβ).5−7 Aβ is produced by the sequential proteolysis of the amyloid precursor protein (APP), but because γ-secretase can cleave APP at multiple sites, this gives rise to peptides with a variety of different C-termini.1,8 Of these fragments, Aβ(1–40) is the most common and Aβ(1–42) appears to be most closely linked to disease.9 In vitro Aβ can aggregate into well-ordered β-sheet-rich fibrillar structures, and plaques containing fibrillar Aβ are found in the brain of AD patients. Initially, amyloid plaques were thought to be the primary cause of synaptic and neuronal loss, but recent data suggest that smaller diffusible assemblies may be the proximate mediators of these effects.9−12 In particular, samples containing dimers and trimers have been found to be significantly more toxic than monomers.13 It has also been suggested that the whole aggregation process, rather than a specific oligomer, is the critical and toxic event.14,15 Similarly, some have speculated that the deposition of Aβ in plaque may work as a protective mechanism.11 Understanding the mechanisms that cause Aβ monomers to aggregate and form oligomers and fibrils is of obvious importance, since it could facilitate the development of agents that therapeutically target toxic assemblies or prevent their formation. A full appreciation of this process will require elucidation of both intrinsic and extrinsic factors that affect the aggregation rate and mechanism.
Aβ is amphiphatic with a charged N-terminus, a central hydrophobic region, LVFFA (Aβ(17–21)), and a long hydrophobic C-terminal tail. Previous studies have indicated that this central hydrophobic region plays a key role in Aβ aggregation.16−19 A striking feature of this region is the presence of two phenylalanine (Phe) residues. Aromatic amino acids are found in many proteins that self-assemble and aggregate to cause human diseases.20 The role of the LVFFA region has been studied both for Aβ(1–40) and Aβ(1–42) and for short fragments of those two peptides.21−28 Inhibitors containing aromatic groups have been synthesized to prevent Aβ aggregation.23,25 The D-enantiomer of the hexapeptide KLVFFA (encompassing residue 16–21 of Aβ) and analogues thereof seems to bind to and inhibit Aβ(1–40) and Aβ(1–42) aggregation, as monitored by circular dichroism (CD) spectroscopy21 and electron microscopy.27 These short peptides work as β-sheet blockers and prevent further fibrillization of the full-length peptide. The longer peptide, KLVFFAE with N-methyl amino acids at alternate residue positions shows little propensity for aggregation, presumably due to the methyl groups reducing the H-bonding necessary for β-sheet formation, as confirmed by CD spectroscopy and ultracentrifugation.22 Introduction of proline residues into this sequence also prevents aggregation presumably due to its disruptive effect on secondary structure.29 Studies of short peptide fragments comprising residues 15–23 and 12–26 of Aβ show that replacement of any residue in the 17–23 range with proline inhibits fibril formation, which is confirmed with Congo Red binding assay, electron microscopy, CD spectroscopy, and a HPLC assay.28 Introduction of proline into an even shorter Aβ analogue (LPFFD) resulted in a peptide that inhibited Aβ(1–40) and Aβ(1–42) fibril formation, disassembled preformed fibrils, ameliorated Aβ(1–40)-induced toxicity in neuroblastoma cells and reduced cerebral deposition of Aβ in an APP transgenic mouse.26
The inhibitory action of short peptides or compounds containing aromatic groups is suggested to rely on π-stacking between the aromatic groups. Even though the structure becomes more ordered when two aromatic groups interact, this process seems to be driven by entropy; water molecules are released from the aromatic rings when they interact via π-stacking.20 Substituting the phenylalanines in the shorter prototypes, Aβ(10–42) or Aβ(10–43) with hydrophobic or polar residues resulted in less β-sheet content comparing to the wild type prototypes. Out of all combinations tested, AβF19GF20I and AβF19TF20T showed most notable results. Even though they formed filaments, they could not be detected with Congo red and did also inhibit filament formation when mixed with the wild type prototype.18 Positions 19 and 20 have also been studied in full-length Aβ(1–40) and Aβ(1–42), and the double mutant F19LF20L was found to form fibrils in similar manner as the wild type peptide.30 Aβ(1–40) substituted with Pro at position 19 (Aβ(1–40)F19P) was not prone to aggregation,31 and other studies have shown that Aβ(1–40)F19P does not self-assemble but weakly interacts with wild type fibrils.32 Also Aβ(1–42)F19D, a mutation that reduces both the hydrophobicity and β-sheet propensity, and introduces one extra negative charge, resulted in disruption of aggregation.19 Despite all previous studies in the central hydrophobic region so far, there is no detailed data on the aggregation kinetics for any Aβ variants with aromatic substitutions.
While solution NMR shows that Aβ monomer is largely unstructured,24 there are a number of solid state NMR structures for fibrillar Aβ. Although differing in the detailed topology, these structures suggest that Aβ(1–40)33−35 and Aβ(1–42)36 adopt a β-turn-β motif. In all models presented, F19 interacts with at least one hydrophobic amino acid (V, L, I, or G) on the opposite β-strand in the β-turn-β motif, while in most models F20 mainly interacts with hydrophobic residues in the same strand. In the fibril, F19 from different monomers seem to stack on top of each other in an extended array and there is also interaction with other hydrophobic residues on adjacent monomers. Interestingly, the same is true for F20, but neither F19 nor F20 seem to be involved in interprotofilament contacts.24,33−36 X-ray fiber/powder diffraction and IR spectroscopy of Aβ(16–22) with and without cyanophenylalanine at positions 19 and 20 also support the involvement of F19 in hydrophobic interactions with V18, while F20 because of its proximity to G22 in the same β-sheet is in a more hydrophilic environment.37
In the present work, we have investigated how substitutions of Phe19 and Phe20 of Aβ(M1–42) (where M stands for the initiating Met residue which is needed when expressing the peptide) affect the aggregation rate. Leucine was introduced to positions 19 and 20 either singly or in combination and was chosen because it has similar hydrophobicity and van der Waals volume as phenylalanine but lower propensity for β-sheet structure and it does not allow π-stacking.30,38,39 The aggregation kinetics were studied using a highly reproducible ThT assay,40 while enzyme-linked immunosorbent assay (ELISA) was used to estimate the monomer concentration at equilibrium.40 The secondary structure and aggregate morphology were studied using circular dichroism (CD) spectroscopy and cryo-transmission electron microscopy (cryo-TEM). Our results imply that Phe19 plays an important role in the nucleation of aggregation.
Results and Discussion
The propensity of the four peptides to form amyloid fibrils was assessed by monitoring changes in ThT fluorescence, secondary structure, aggregate morphology, and soluble concentration of monomer at equilibrium. When ThT binds to amyloid fibrils, it undergoes a red-shift in its emission spectrum with an enhanced quantum yield,41,42 a property that has been exploited to monitor amyloid formation. Here we used ThT fluorescence to monitor the kinetics of the fibril formation at 25–44 different peptide concentrations in the range 0.3–10 μM. All peptides were found to form ThT active species with maxima between 480 and 484 nm (Supporting Information Figure SI 1). Figure 1 shows examples of experimental data (ThT fluorescence as function of time) at three concentrations (6, 4, and 2 μM; four replicates of each peptide) from one experiment with wild type (wt), F19L, F20L, and F19LF20L. From these time-dependent ThT data, the half-time for aggregation, t1/2, was estimated by fitting a sigmoidal function (eq 1) to every curve (Supporting Information Figure SI 2). Note that this is just a mathematical function that fits the data reasonably well. The half-time is then plotted as a function of peptide concentration in Figure 2, and a power function (eq 2) is fitted to that data.
Figure 1.
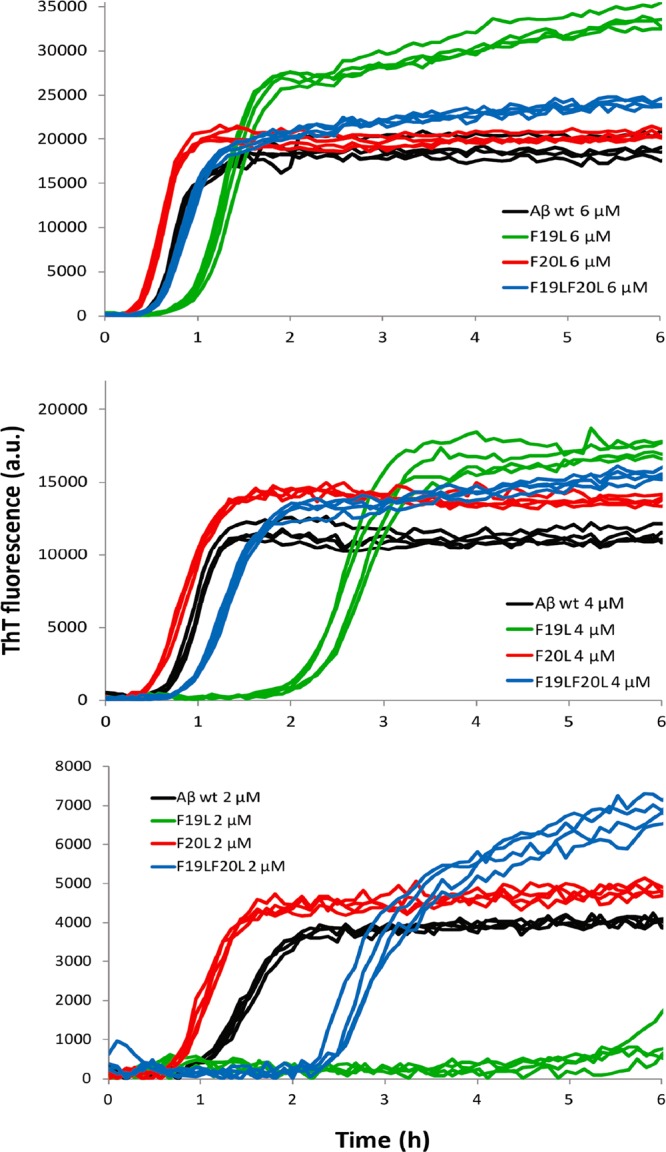
ThT fluorescence intensity as a function of time for Aβ42 wt (black), F19L (green), F20L (red), and F19LF20L (blue) at 6, 4, and 2 μM in the upper, middle, and lower panel, respectively. All samples contain 12 μM ThT, 20 mM sodium phosphate, 200 μM EDTA, and 0.02% NaN3, pH 8.0. Four replicates of each peptide at each concentration are shown, and the data shown are representative of three such experiments. F19L and F19LF20L have a longer half-time than wt, most significant for F19L, while F20L has a shorter half-time.
Figure 2.
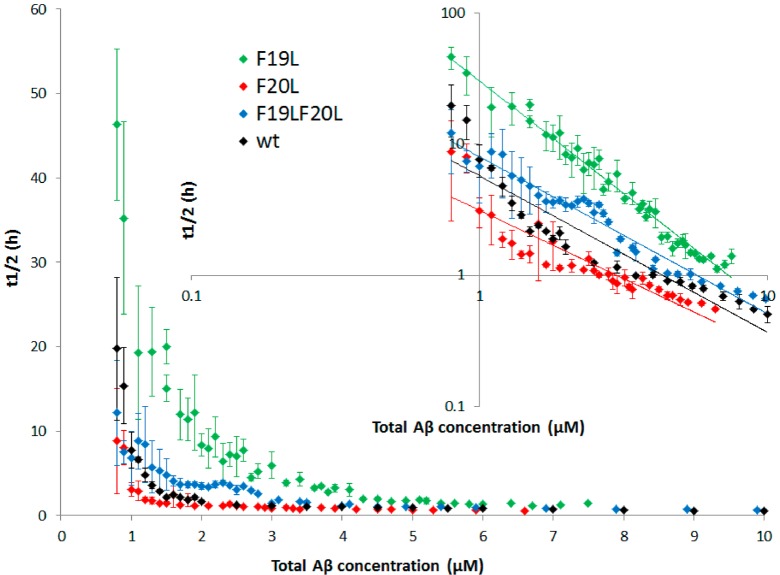
Half-time as a function of total Aβ42 concentration for wt (black), F19L (green), F20L (red), and F19LF20L (blue). All data points are an average of at least four replicates with error bars representing the standard deviation. Inset: The same data with logarithmic axes. The solid lines are power functions fitted to the experimental data. F19L has longer half-time compared to wt at all concentrations and steeper concentration dependence.
There is a clear difference between wt and F19L. F19L aggregates significantly more slowly than wt with a longer t1/2 over the entire concentration interval studied. Below ca. 0.8 μM, there is more scatter in the data, so here we focus on the results obtained in the range 0.8–10 μM. The difference is most pronounced, around 1–2 μM, where t1/2 is ca. 8 times longer for F19L than for wt. This suggests that nucleation is slower for F19L. In contrast, F20L appears more prone to aggregate than either wt or F19L. It has a slightly shorter half-time than wt, which means that fibrils are formed faster for this mutant. The effect is small, but it persists over all concentrations between 0.8 and 10 μM (Figure 2, inset). When both mutations are present in the same peptide, their opposite effects are somewhat neutralized. The F19LF20L peptide is slightly less prone to aggregate than wt, but exhibits a much greater propensity for aggregation than does F19L. In keeping with this observation, F19LF20L is significantly less prone to aggregate than F20L. Thus, the presence of an aromatic side chain in position 19 contributes to accelerating the aggregation process, whereas an aromatic side chain in position 20 retards it.
The scaling exponent α from the power function fitted to the concentration-dependence of the half-time (Table 1) is also significantly lower (more negative) for F19L compared to the other peptides, meaning a significantly steeper concentration dependence for F19L as clearly seen in the double logarithmic plot (Figure 2, inset). The aggregation mechanism for wild type was recently found to involve both primary (from monomer only) and secondary (from monomer and fibril) nucleation steps.43 Primary nucleation involves monomer only and happens first when the starting condition is pure monomer. These nuclei grow quickly and fibrils appear very early during the lag phase of the process, but their concentration is not detectable by ThT fluorescence. Fibrils provide a catalytic surface for nucleation from monomers, and the secondary process becomes faster than primary nucleation. This reveals itself both in the shape of individual aggregation curves and in the concentration-dependence of the reaction half-time.43,44 The steeper concentration dependence as observed for F19L could mean either a higher relative importance of secondary over primary nucleation or a larger nucleus size (by one peptide) compared to wt.44
Table 1. Parameters from the Power Function Fitted to the Concentration Dependent Half-Time Data.
| eq 2 | wt | F19L | F20L | F19LF20L |
|---|---|---|---|---|
| B | 6 | 31 | 3 | 8 |
| α | –1.2 | –1.7 | –1.0 | –1.2 |
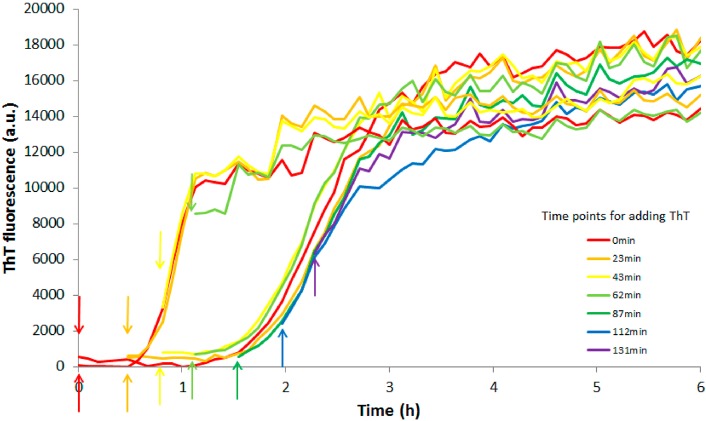
There is also a difference in the ThT fluorescence intensity at equilibrium between the four peptides. The difference is most significant for F19L, and this peptide seems to give higher intensity (Figure 1). The ThT intensity for F19L is on average 58% higher compared to wt in the range 0.8–10 μM. The increase in ThT intensity has been interpreted to be a consequence of more fibrils being formed.30 However, when 0.8–10 μM wt is allowed to aggregate 90–99% of the peptide is sedimentable.40 This is also confirmed by the gel filtration experiment which fails to detect any monomers in equilibrium with fibrils (Supporting Information Figure SI 3). Thus, even if 100% of any of the mutants aggregated to form fibrils, this small increase would be unlikely to account for the observed increase in ThT. Moreover, the final ThT intensity is more or less linear with concentration for each peptide (Figure 1). The different intensities more likely reflect different modes of ThT binding to different types of fibrils and differences in fluorescence quantum yield due to the local environment of the bound dye. A model obtained from simulations suggests that linear dyes such as ThT bind in grooves formed by the side chains in a so-called channel model. The binding is parallel to the long axis of the fibril surface, and there has to be at least five β-strands of a flat β-sheet surface to accommodate one ThT molecule.45 It is also reported that ThT interacts strongly with both aromatic and leucine residues.45 To exclude that the significant difference in half-time and ThT intensity between wt and F19L is due to different affinities of ThT for the products (fibrils), the dye was added at different time points (Figure 3). The concentration of each peptide was 4 μM; otherwise, the conditions are the same as in Figure 1. The upper and lower arrows indicate the time points where ThT is added to wt and F19L, respectively. We consistently observe that the wt peptide has a shorter half-time compared to F19L, irrespective of when ThT is added, and the half-times for both peptides are almost identical as in Figure 1 (middle panel). Different concentrations of ThT have also been added to the wt peptide without affecting the half-time.43
Figure 3.
ThT fluorescence intensity as a function of time for 4 μM Aβ42 wt or F19L. The different colors correspond to the time points when 12 μM ThT is added to each sample. The upper and lower arrows correspond the ThT additions to wt and F19L, respectively. Every color represents an average out of two experiments. All samples contain 20 mM sodium phosphate, 200 μM EDTA, and 0.02% NaN3, pH 8.0. F19L still has a longer half-time than wt even though ThT is added at different time points.
All three mutants show similar behavior as the wt in the sedimentation assay using ELISA to estimate Aβ in solution.40 For all mutants, the results are indicative of a phase transition, and above the transition point the monomer concentration is constant or decreases with increasing total peptide concentration (Supporting Information Figure SI 4).
Another way to monitor the kinetics of the fibril formation is to follow secondary structure changes using far-UV circular dichroism spectroscopy. This reveals whether the mutants have the same structure as the wild type in monomer and fibril state. The four peptides were studied at 5 μM in 5 mM phosphate buffer, 40 mM NaF, pH 8.0, at 37 °C in quartz cuvette. Because the surface (quartz vs PEGyltated polystyrene) and buffer conditions are different compared to the ThT assay, and instead of shaking we used a magnetic stirrer for continuous mixing of the solution, the half-time cannot be compared with the one achieved from the ThT assay.
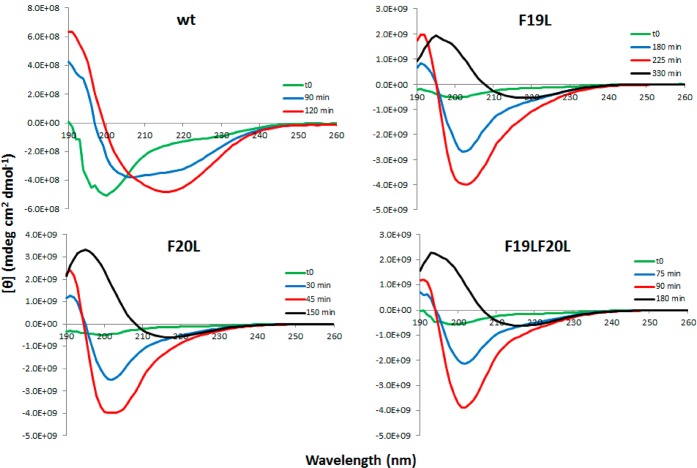
Figure 4 shows CD spectra for wt and F19L in the upper panel and F20L and F19LF20L in the lower panel. Green curves show spectra recorded at time zero (t = 0), that is, directly when the cuvette is placed in the instrument. For all peptides at t = 0, there is a single negative peak with a minimum at 200 nm, typical for random coil structure in agreement with other reports.46,47 At 120 min (red curve), the wild type has formed fibrils, and the spectrum has a maximum at 192 nm and a broad minimum at 216 nm indicative of a β-sheet structure19,46,47 and a maximum at 191 nm. At intermediate time points (90 min shown), the wild type spectrum resembles that of peptides in α-helical structure. However, this spectrum can be generated as a superposition of the spectra at t = 0 and t = 120 min, multiplied by 0.41 and 0.59, respectively (Figure 5, orange line), and thus, a mixture of 41% monomer and 59% fibril would give the same spectrum. The behavior of the three mutants was similar for each, but distinct from the wt, and the random coil signal is observed to decay at different time points, as expected from the results of the ThT assay. At t = 0, the mutant peptides produced spectra with a single broad minimum around 200 nm, but upon incubation the strength of the minimum increased and shifted toward 202 nm. Also distinct maxima at 192 nm became apparent (blue and red curves for F19L, F20L, and F19LF20L in Figure 4). After a certain time point (different between the mutants), the intensity reaches a maximum and does not change over time. If stirring is stopped at this time point, the spectrum acquires the same shape and intensity as the one for wild type fibrils and corresponds to a β-sheet structure with a minimum at 216, 217, and 218 nm and a maximum at 193, 195, and 195 for F19LF20L, F20L, and F19L, respectively (black curves in Figure 4). The y-axis scale in Figure 4 is varied between the panels so that all the spectra for each peptide fit in one figure. In Supporting Information Figures SI 5 and 6, the y-axis is the same in all panels. Clearly, at time zero (the green curves) and at the end point (red for wt and black for the mutants), wt and mutants have their minima and maxima at a similar wavelength (Supporting Information Figures SI 5 and 6). This verifies that all peptides start with a random coil structure and end with a β-sheet. However, stirring seems to align the mutant fibrils in a way, producing a strong signal with a minimum at 202 nm, which is not seen for the wild type. Similar strong signal around 202 nm is seen with linear dichroism spectroscopy when the alignment of fibrils from a fragment of β2-microglobulin is studied as a function of the flow rate.48
Figure 4.
Far-UV CD spectra for Aβ42 wt and F19L in the upper panels and F20L and F19LF20L in the lower panels at different time points. The concentration of all peptides is 5 μM. All spectra are recorded during continuous stirring, except for the black curves which are at quiescent condition. In all cases, the structure changes from random coil at the beginning of the experiment to β-sheet in the end.
Figure 5.
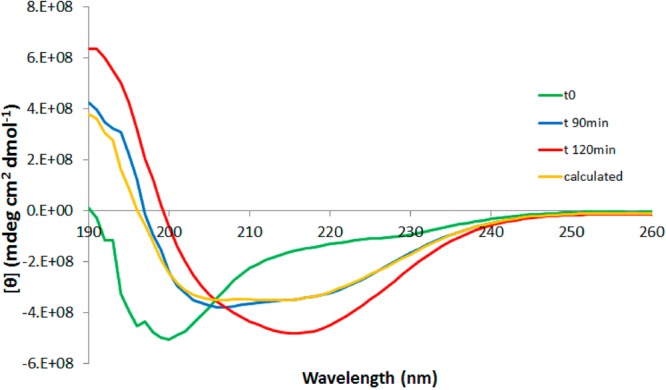
Far-UV CD spectra of Aβ42 wt. The same spectra as the one shown in Figure 3 with the addition of the orange line, which is generated as a superposition of the spectra at t = 0 and t = 120 min multiplied by 0.41 and 0.59, respectively. The sample at intermediate time (90 min) contains a mixture of unstructured peptide and fibril. No other species are seen.
The CD analysis implies that aromatic rings at positions 19 and 20 play an important role in how the peptides are ordered in fibrils but the effect of changing Phe to Leu is only seen when a mechanical force is applied by stirring the sample. In spite of this behavior, the half-time follows the same trend as in the ThT assay (Figure 6), independent of the different conditions (buffer, surface, mixing) used in the CD experiments. It is also another validation that the difference in kinetics between the four peptides is not caused by ThT.
Figure 6.
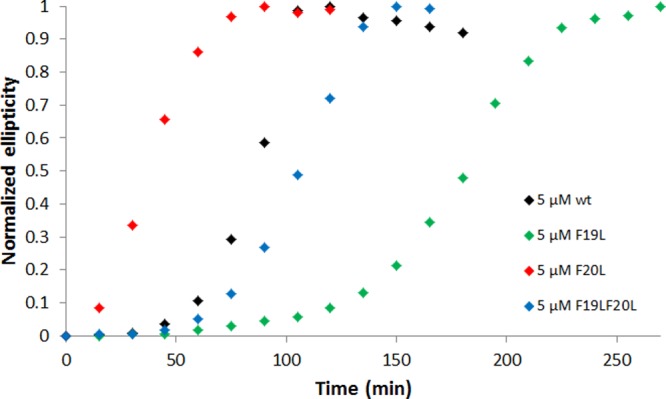
Normalized ellipticity at 218 nm as a function of time. All samples contain 5 μM peptide in 5 mM sodium phosphate buffer, pH 8.0 with 40 mM NaF and without ThT. The half-time cannot be compared with the one in the ThT assay because the conditions are not the same (buffer, surface, mixing). Still it is the same trend as with the ThT assay.
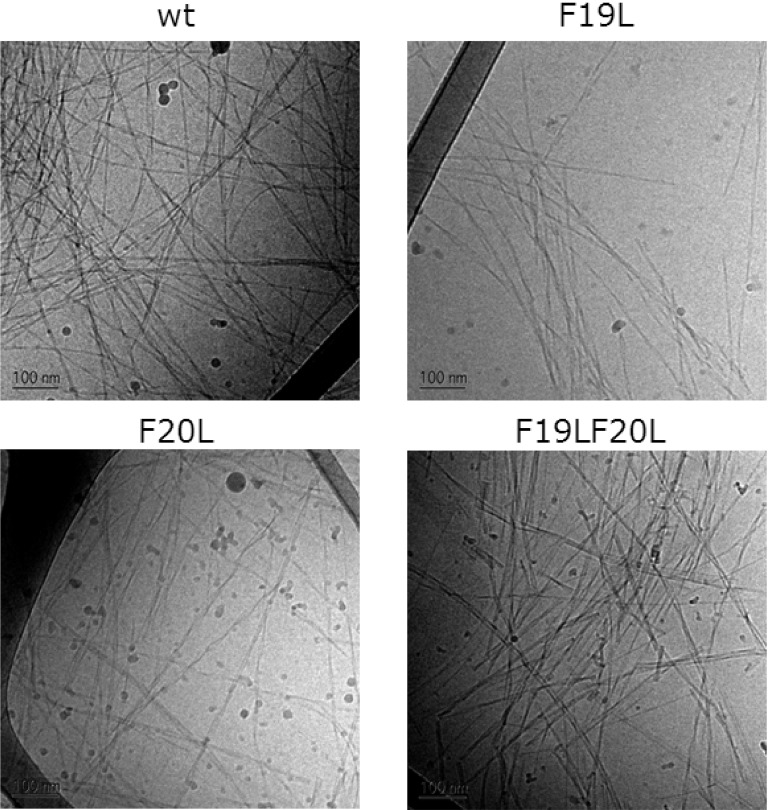
Next we used cryo-transmission electronic microscopy (cryo-TEM) to assess the morphology of aggregates formed after agitation at 37 °C for five to seven days. It is confirmed that all the peptides formed fibrils (Figure 7) and the average width estimated at this resolution is 6 nm (Supporting Information Table SI 1).
Figure 7.
Cryo-TEM results of Aβ42 wt and F19L in the upper panels and F20L and F19LF20L in the lower panels. Fibrils are formed in all cases with only a slight difference in the morphology.
The results of the present study suggest that Leu is well accommodated in fibrils both at position 19 and 20. The Phe to Leu substitutions do not interfere with the fibril formation equilibrium, and the morphology is similar in all cases. This is in line with earlier finding of fibril formation by Aβ42 variants containing a variety of hydrophobic exchange substitutions.49 However, we have shown that a Phe to Leu substitution at position 19 significantly affects the aggregation rate, seen both as an extended half-time and steeper concentration dependence, suggesting a change in aggregation mechanism involving a change in the relative rates of underlying microscopic processes.44 One driving force for nucleation may be the hydrophobic effect, leading to association of hydrophobic segments to release water, thereby increasing the entropy. Counteracting this effect may be steric hindrance in the formed nucleus. Phe and Leu have similar hydrophobicity,39 and Aβ wt and F19L have the same net charge and hydrogen bonding capacity. Therefore, aromatic stacking and steric hindrance might be the crucial differences governing nucleation in the case of Phe19 and/or disfavoring nucleation in the case of Leu19.
In summary, this work highlights the importance of position 19 and shows that the aromatic group of F19 plays a role in the onset of fibril formation. In contrast the aromatic group of F20 retards aggregation. This knowledge may stimulate searches for compounds or proteins that bind to the aromatic groups and inhibit or slow down the aggregation process combined with kinetic studies aimed at understanding which event along the pathway is affected.
Methods
Expressing the Peptides
The genes coding for wild type Aβ(M1–42) and the designed mutants Aβ(M1–42)F19L, Aβ(M1–42)F20L, and Aβ(M1–42)F19LF20L were produced by overlapping PCR, cloned into the PetSac vector and expressed in E. coli.50 The purification procedure involves sonication and isolation of inclusion bodies by centrifugation, dissolving these in urea, and isolation of the peptide by ion exchange and size exclusion steps.50 Thereafter, solutions of purified peptide were lyophilized and stored as dried powder until needed.
Preparation of Samples
All experiments started by using size exclusion chromatography (SEC) to isolate solutions of monomeric peptide. This was achieved by dissolving approximately 170 μg of peptide in 1.0 mL of 6 M GuHCl for 30 min (to dissolve pre-existing aggregates). Thereafter, the Aβ GuHCl solution was injected on to a Superdex 75 10/300 GL column using a fast liquid protein chromatography (FPLC) system eluted at 0.7 mL/min in the desired buffer (Supporting Information Figure SI 7). For ThT, TEM, and ELISA experiments, monomers were eluted in 20 mM sodium phosphate buffer, pH 8.0, with 200 μM EDTA and 0.02% NaN3, whereas 5 mM sodium phosphate with 40 mM NaF, pH 8.0, was used for CD spectroscopy. The center of the monomer peak was collected (Supporting Information Figure SI 7) to minimize contamination from E. coli proteins or soluble aggregates or salts, and peptide concentration determined by absorbance at 280 nm using ε280 = 1440 M–1 cm–1 and by amino acid analysis.
Kinetic Aggregation Experiments
Both the monomer solution and the sodium phosphate buffer used for preparing the experimental samples contained thioflavin T (ThT) at a final concentration of 12 μM. All solutions were kept on ice before starting the experiments. Low binding Eppendorf tubes (Genuine Axygen Quality, Microtubes, MCT-200-L-C) were used to prepare dilution series of 24 samples with concentrations ranging between 0.3 and 10 μM. Each tube contained a total volume of 400 μL, and the solution was mixed by turning the tube upside down, instead of vortexing, to avoid air bubbles. A Corning 3881, 96-well half-area plate of black polystyrene with a clear bottom and PEG coating was used, and each well was loaded with 100 μL of sample. The samples with lowest concentrations were loaded first and the highest last. The plate was sealed with a plastic film (Corning 3095). The plate was placed in a Fluostar Omega plate reader (BMG Labtech, Offenburg, Germany) and incubated at 37 °C with orbital shaking (100 rpm) between reads. ThT fluorescence was measured every 6 min up to 72 h through the bottom of the plate, with the excitation and emission at 440 and 480 nm, respectively. Each mutant was studied in three different plates with quadruplicate samples for each of the 24 concentrations. The half-time (t1/2) was estimated by fitting the following sigmoidal function to each curve:
| 1 |
where F0 is the baseline before aggregation, A is the amplitude, and k is the apparent elongation rate constant. The following power function was used to fit the half-time versus the total Aβ concentration, c
| 2 |
where B is a proportionality constant and α is an exponent.
Cryogenic Transmission Electron Microscopy (cryo-TEM)
The samples used for cryo-TEM were prepared and incubated in the same way as for the kinetic aggregation experiments and did also contain ThT. A sample of each peptide with a concentration of 10 μM was incubated for 5–7 days. Specimens for electron microscopy were prepared in a controlled environment vitrification system (CEVS) to ensure stable temperature and to avoid loss of solution during sample preparation. The specimens were prepared as thin liquid films, <300 nm thick, on lacey carbon filmed copper grids and plunged into liquid ethane at −180 °C. This leads to vitrified specimens, avoiding component segmentation and rearrangement, and water crystallization, thereby preserving original microstructures. The vitrified specimens were stored under liquid nitrogen until measured. An Oxford CT3500 cryoholder and its workstation were used to transfer the specimen into the electron microscope (Philips CM120 BioTWIN Cryo) equipped with a postcolumn energy filter (Gatan GIF100). The acceleration voltage was 120 kV. The images were recorded digitally with a CCD camera under low electron dose conditions. The width of the fibrils was measured using the software ImageJ.
Enzyme-Linked Immunosorbent Assay (ELISA)
The samples used for ELISA were prepared in the same way as for the kinetic experiments but did not contain ThT. To allow maximal aggregation, samples were incubated at 37 °C with shaking for 6–7 days. Large aggregates were sedimented by centrifugation at 19 900g for 20 min, and the upper 10% of supernatant was removed and the amount of peptide remaining in solution was measured by ELISA.40 ELISA was used, since the amount of peptide remaining in solution was lower than that which could be measured reliably by absorbance at 280 nm. Moreover, this sort of ELISA preferentially recognizes Aβ monomer and therefore allows us to estimate the concentration of monomer when fibril formation has reached a steady state level. The reported data is an average out of two to six wells for each of the 24 concentrations. Calibration curves were generated for separate dilution series of the four peptides to identify the linear response region, and all samples were diluted to fall in this region.
Circular Dichroism (CD) Spectroscopy
The ellipticity was recorded between 260 and 190 nm in a quartz (QS) cuvette with 10 mm path length at 37 °C during continuous stirring unless otherwise noted, using a Jasco J-815 CD spectrometer. The scanning rate was 50 nm/min, the digital integration time per data point (D.I.T.) 8 s, sensitivity set to standard, the background signal from the buffer has been subtracted, and the reported data are averaged over 3 accumulations; 5 mM sodium phosphate buffer, pH 8.0 with 40 mM NaF was used, and the peptide concentration was 5 μM.
Acknowledgments
We thank Gunnel Karlsson at Biomicroscopy Unit, Polymer and Materials Chemistry, Chemical Centre, Lund University, Lund, Sweden for the assistance with the cryo-TEM work.
Supporting Information Available
Chromatogram from the isolation step of the monomer, and the equilibrium experiment. ThT fluorescence spectra from all the fibrils. Experimental and fitted data from the kinetic experiments. Equilibrium data from the ELISA experiments. Circular dichroism spectra with different scaling of the y-axis. Table presenting the width of the four different fibrils. This material is available free of charge via the Internet at http://pubs.acs.org.
This study was funded by the Crafoord Foundation, the Swedish Research Council, Lars Hierta Foundation, the research school FLÄK of Lund University, Science Foundation Ireland (08/INI/B2033) and the Health Research Board of Ireland (PD/2008/40).
The authors declare no competing financial interest.
Supplementary Material
References
- Selkoe D. J. (1999) Translating cell biology into therapeutic advances in Alzheimer’s disease. Nature 399, A23–31. [DOI] [PubMed] [Google Scholar]
- Hardy J.; Allsop D. (1991) Amyloid deposition as the central event in the aetiology of Alzheimer’s disease. Trends Pharmacol. Sci. 12, 383–388. [DOI] [PubMed] [Google Scholar]
- Selkoe D. J. (1991) The molecular pathology of Alzheimer’s disease. Neuron 6, 487–498. [DOI] [PubMed] [Google Scholar]
- Golde T. E.; Schneider L. S.; Koo E. H. (2011) Anti-abeta therapeutics in Alzheimer’s disease: the need for a paradigm shift. Neuron 69, 203–213. [DOI] [PMC free article] [PubMed] [Google Scholar]
- Hardy J.; Selkoe D. J. (2002) The amyloid hypothesis of Alzheimer’s disease: progress and problems on the road to therapeutics. Science 297, 353–356. [DOI] [PubMed] [Google Scholar]
- Qiu W. Q.; Folstein M. F. (2006) Insulin, insulin-degrading enzyme and amyloid-beta peptide in Alzheimer’s disease: review and hypothesis. Neurobiol. Aging 27, 190–198. [DOI] [PubMed] [Google Scholar]
- Selkoe D. J. (2000) The origins of Alzheimer disease: a is for amyloid. JAMA. J. Am. Med. Assoc. 283, 1615–1617. [DOI] [PubMed] [Google Scholar]
- De Strooper B. (2010) Proteases and proteolysis in Alzheimer disease: a multifactorial view on the disease process. Physiol. Rev. 90, 465–494. [DOI] [PubMed] [Google Scholar]
- Walsh D. M.; Selkoe D. J. (2007) A beta oligomers - a decade of discovery. J. Neurochem. 101, 1172–1184. [DOI] [PubMed] [Google Scholar]
- Lacor P. N.; Buniel M. C.; Furlow P. W.; Clemente A. S.; Velasco P. T.; Wood M.; Viola K. L.; Klein W. L. (2007) Abeta oligomer-induced aberrations in synapse composition, shape, and density provide a molecular basis for loss of connectivity in Alzheimer’s disease. J. Neurosci. 27, 796–807. [DOI] [PMC free article] [PubMed] [Google Scholar]
- Hung L. W.; Ciccotosto G. D.; Giannakis E.; Tew D. J.; Perez K.; Masters C. L.; Cappai R.; Wade J. D.; Barnham K. J. (2008) Amyloid-beta peptide (Aβ neurotoxicity is modulated by the rate of peptide aggregation: Abeta dimers and trimers correlate with neurotoxicity. J. Neurosci. 28, 11950–11958. [DOI] [PMC free article] [PubMed] [Google Scholar]
- Walsh D. M.; Selkoe D. J. (2004) Deciphering the molecular basis of memory failure in Alzheimer’s disease. Neuron 44, 181–193. [DOI] [PubMed] [Google Scholar]
- Roher A. E.; Chaney M. O.; Kuo Y. M.; Webster S. D.; Stine W. B.; Haverkamp L. J.; Woods A. S.; Cotter R. J.; Tuohy J. M.; Krafft G. A.; Bonnell B. S.; Emmerling M. R. (1996) Morphology and toxicity of Abeta-(1–42) dimer derived from neuritic and vascular amyloid deposits of Alzheimer’s disease. J. Biol. Chem. 271, 20631–20635. [DOI] [PubMed] [Google Scholar]
- Jan A.; Adolfsson O.; Allaman I.; Buccarello A. L.; Magistretti P. J.; Pfeifer A.; Muhs A.; Lashuel H. A. (2011) Abeta42 neurotoxicity is mediated by ongoing nucleated polymerization process rather than by discrete Abeta42 species. J. Biol. Chem. 286, 8585–8596. [DOI] [PMC free article] [PubMed] [Google Scholar]
- Wogulis M.; Wright S.; Cunningham D.; Chilcote T.; Powell K.; Rydel R. E. (2005) Nucleation-dependent polymerization is an essential component of amyloid-mediated neuronal cell death. J. Neurosci. 25, 1071–1080. [DOI] [PMC free article] [PubMed] [Google Scholar]
- Esler W. P.; Stimson E. R.; Ghilardi J. R.; Lu Y. A.; Felix A. M.; Vinters H. V.; Mantyh P. W.; Lee J. P.; Maggio J. E. (1996) Point substitution in the central hydrophobic cluster of a human beta-amyloid congener disrupts peptide folding and abolishes plaque competence. Biochemistry 35, 13914–13921. [DOI] [PubMed] [Google Scholar]
- Tjernberg L. O.; Callaway D. J.; Tjernberg A.; Hahne S.; Lilliehook C.; Terenius L.; Thyberg J.; Nordstedt C. (1999) A molecular model of Alzheimer amyloid beta-peptide fibril formation. J. Biol. Chem. 274, 12619–12625. [DOI] [PubMed] [Google Scholar]
- Hilbich C.; Kisterswoike B.; Reed J.; Masters C. L.; Beyreuther K. (1992) Substitutions of hydrophobic amino-acids reduce the amyloidogenicity of Alzheimers-disease beta-A4 peptides. J. Mol. Biol. 228, 460–473. [DOI] [PubMed] [Google Scholar]
- de Groot N. S.; Aviles F. X.; Vendrell J.; Ventura S. (2006) Mutagenesis of the central hydrophobic cluster in A beta 42 Alzheimer’s pepticle - Side-chain properties correlate with aggregation propensities. FEBS J. 273, 658–668. [DOI] [PubMed] [Google Scholar]
- Gazit E. (2002) A possible role for pi-stacking in the self-assembly of amyloid fibrils. FASEB J. 16, 77–83. [DOI] [PubMed] [Google Scholar]
- Chalifour R. J.; McLaughlin R. W.; Lavoie L.; Morissette C.; Tremblay N.; Boule M.; Sarazin P.; Stea D.; Lacombe D.; Tremblay P.; Gervais F. (2003) Stereoselective interactions of peptide inhibitors with the beta-amyloid peptide. J. Biol. Chem. 278, 34874–34881. [DOI] [PubMed] [Google Scholar]
- Gordon D. J.; Sciarretta K. L.; Meredith S. C. (2001) Inhibition of beta-amyloid(40) fibrillogenesis and disassembly of beta-amyloid(40) fibrils by short beta-amyloid congeners containing N-methyl amino acids at alternate residues. Biochemistry 40, 8237–8245. [DOI] [PubMed] [Google Scholar]
- Porat Y.; Abramowitz A.; Gazit E. (2006) Inhibition of amyloid fibril formation by polyphenols: structural similarity and aromatic interactions as a common inhibition mechanism. Chem. Biol. Drug Des. 67, 27–37. [DOI] [PubMed] [Google Scholar]
- Rauk A. (2009) The chemistry of Alzheimer’s disease. Chem. Soc. Rev. 38, 2698–2715. [DOI] [PubMed] [Google Scholar]
- Scherzer-Attali R.; Pellarin R.; Convertino M.; Frydman-Marom A.; Egoz-Matia N.; Peled S.; Levy-Sakin M.; Shalev D. E.; Caflisch A.; Gazit E.; Segal D. (2010) Complete phenotypic recovery of an Alzheimer’s disease model by a quinone-tryptophan hybrid aggregation inhibitor. PLoS One 5, e11101. [DOI] [PMC free article] [PubMed] [Google Scholar]
- Soto C.; Sigurdsson E. M.; Morelli L.; Kumar R. A.; Castano E. M.; Frangione B. (1998) Beta-sheet breaker peptides inhibit fibrillogenesis in a rat brain model of amyloidosis: implications for Alzheimer’s therapy. Nat. Med. 4, 822–826. [DOI] [PubMed] [Google Scholar]
- Tjernberg L. O.; Naslund J.; Lindqvist F.; Johansson J.; Karlstrom A. R.; Thyberg J.; Terenius L.; Nordstedt C. (1996) Arrest of beta-amyloid fibril formation by a pentapeptide ligand. J. Biol. Chem. 271, 8545–8548. [DOI] [PubMed] [Google Scholar]
- Wood S. J.; Wetzel R.; Martin J. D.; Hurle M. R. (1995) Prolines and amyloidogenicity in fragments of the Alzheimer’s peptide beta/A4. Biochemistry 34, 724–730. [DOI] [PubMed] [Google Scholar]
- Minor D. L. Jr.; Kim P. S. (1994) Context is a major determinant of beta-sheet propensity. Nature 371, 264–267. [DOI] [PubMed] [Google Scholar]
- Armstrong A. H.; Chen J.; McKoy A. F.; Hecht M. H. (2011) Mutations that replace aromatic side chains promote aggregation of the Alzheimer’s Abeta peptide. Biochemistry 50, 4058–4067. [DOI] [PMC free article] [PubMed] [Google Scholar]
- Walsh D. M.; Lomakin A.; Benedek G. B.; Condron M. M.; Teplow D. B. (1997) Amyloid beta-protein fibrillogenesis. Detection of a protofibrillar intermediate. J. Biol. Chem. 272, 22364–22372. [DOI] [PubMed] [Google Scholar]
- Cannon M. J.; Williams A. D.; Wetzel R.; Myszka D. G. (2004) Kinetic analysis of beta-amyloid fibril elongation. Anal. Biochem. 328, 67–75. [DOI] [PubMed] [Google Scholar]
- Bertini I.; Gonnelli L.; Luchinat C.; Mao J.; Nesi A. (2011) A new structural model of Abeta40 fibrils. J. Am. Chem. Soc. 133, 16013–16022. [DOI] [PubMed] [Google Scholar]
- Paravastu A. K.; Leapman R. D.; Yau W. M.; Tycko R. (2008) Molecular structural basis for polymorphism in Alzheimer’s beta-amyloid fibrils. Proc. Natl. Acad. Sci. U.S.A. 105, 18349–18354. [DOI] [PMC free article] [PubMed] [Google Scholar]
- Petkova A. T.; Yau W. M.; Tycko R. (2006) Experimental constraints on quaternary structure in Alzheimer’s beta-amyloid fibrils. Biochemistry 45, 498–512. [DOI] [PMC free article] [PubMed] [Google Scholar]
- Ahmed M.; Davis J.; Aucoin D.; Sato T.; Ahuja S.; Aimoto S.; Elliott J. I.; Van Nostrand W. E.; Smith S. O. (2010) Structural conversion of neurotoxic amyloid-beta(1–42) oligomers to fibrils. Nat. Struct. Mol. Biol. 17, 561–567. [DOI] [PMC free article] [PubMed] [Google Scholar]
- Inouye H.; Gleason K. A.; Zhang D.; Decatur S. M.; Kirschner D. A. (2010) Differential effects of Phe19 and Phe20 on fibril formation by amyloidogenic peptide A beta 16–22 (Ac-KLVFFAE-NH2). Proteins 78, 2306–2321. [DOI] [PubMed] [Google Scholar]
- Creighton T. E. (1993) Proteins: structures and molecular properties, 2nd ed., pp 4 and 256, W. H. Freeman, New York. [Google Scholar]
- Wolfenden R. (2007) Experimental measures of amino acid hydrophobicity and the topology of transmembrane and globular proteins. J. Gen. Physiol. 129, 357–362. [DOI] [PMC free article] [PubMed] [Google Scholar]
- Hellstrand E.; Boland B.; Walsh D. M.; Linse S. (2010) Amyloid beta-Protein Aggregation Produces Highly Reproducible Kinetic Data and Occurs by a Two-Phase Process. ACS Chem. Neurosci. 1, 13–18. [DOI] [PMC free article] [PubMed] [Google Scholar]
- Naiki H.; Higuchi K.; Hosokawa M.; Takeda T. (1989) Fluorometric determination of amyloid fibrils in vitro using the fluorescent dye, thioflavin T1. Anal. Biochem. 177, 244–249. [DOI] [PubMed] [Google Scholar]
- Levine H. (1995) Thioflavine-T Interaction with Amyloid β-Sheet Structures. Amyloid 2, 1–6. [Google Scholar]
- Cohen S. I., Linse S., Luheshi L., Hellstrand E., White D. A., Rajah L., Otzen D. E., Vendruscolo M., Dobson C. M., and Knowles T. P. J. (2012) Unpublished experiment. [DOI] [PMC free article] [PubMed]
- Cohen S. I.; Vendruscolo M.; Dobson C. M.; Knowles T. P. (2012) From Macroscopic Measurements to Microscopic Mechanisms of Protein Aggregation. J. Mol. Biol. 421, 160–171. [DOI] [PubMed] [Google Scholar]
- Biancalana M.; Koide S. (2010) Molecular mechanism of Thioflavin-T binding to amyloid fibrils. Biochim. Biophys. Acta 1804, 1405–1412. [DOI] [PMC free article] [PubMed] [Google Scholar]
- Tew D. J.; Bottomley S. P.; Smith D. P.; Ciccotosto G. D.; Babon J.; Hinds M. G.; Masters C. L.; Cappai R.; Barnham K. J. (2008) Stabilization of neurotoxic soluble beta-sheet-rich conformations of the Alzheimer’s disease amyloid-beta peptide. Biophys. J. 94, 2752–2766. [DOI] [PMC free article] [PubMed] [Google Scholar]
- Maji S. K.; Loo R. R. O.; Inayathullah M.; Spring S. M.; Vollers S. S.; Condron M. M.; Bitan G.; Loo J. A.; Teplow D. B. (2009) Amino Acid Position-specific Contributions to Amyloid beta-Protein Oligomerization. J. Biol. Chem. 284, 23580–23591. [DOI] [PMC free article] [PubMed] [Google Scholar]
- Adachi R.; Yamaguchi K.; Yagi H.; Sakurai K.; Naiki H.; Goto Y. (2007) Flow-induced alignment of amyloid protofilaments revealed by linear dichroism. J. Biol. Chem. 282, 8978–8983. [DOI] [PubMed] [Google Scholar]
- Kim W.; Hecht M. H. (2006) Generic hydrophobic residues are sufficient to promote aggregation of the Alzheimer’s A beta 42 peptide. Proc. Natl. Acad. Sci. U.S.A. 103, 15824–15829. [DOI] [PMC free article] [PubMed] [Google Scholar]
- Walsh D. M.; Thulin E.; Minogue A. M.; Gustavsson N.; Pang E.; Teplow D. B.; Linse S. (2009) A facile method for expression and purification of the Alzheimer’s disease-associated amyloid beta-peptide. FEBS J. 276, 1266–1281. [DOI] [PMC free article] [PubMed] [Google Scholar]
Associated Data
This section collects any data citations, data availability statements, or supplementary materials included in this article.


