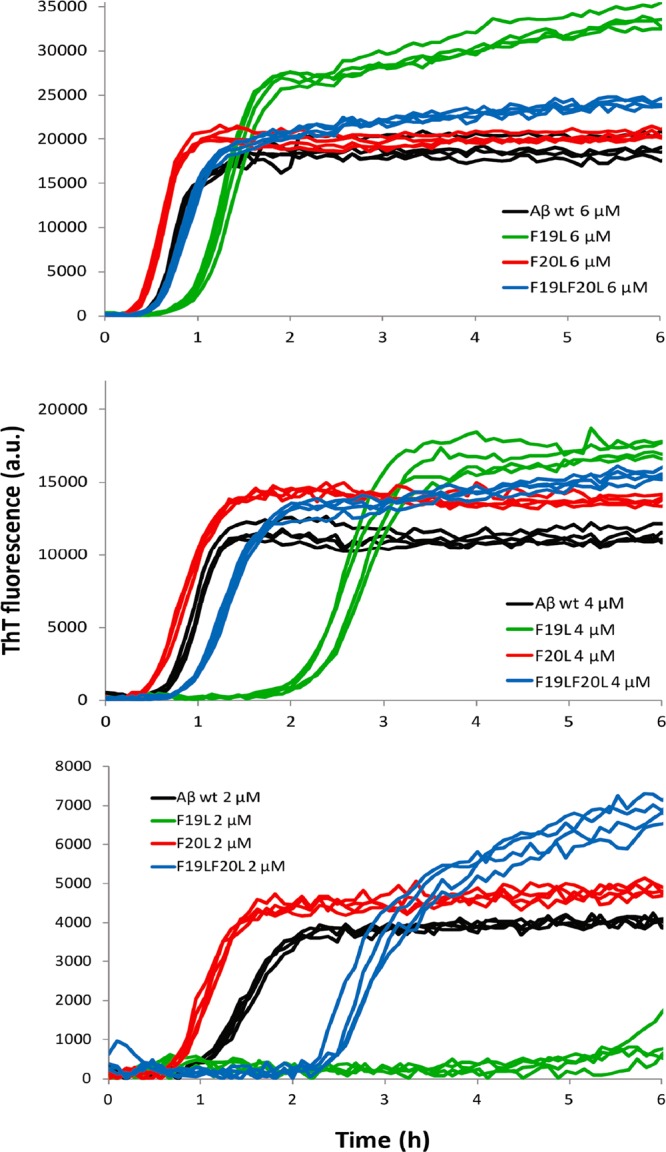
Figure 1.

ThT fluorescence intensity as a function of time for Aβ42 wt (black), F19L (green), F20L (red), and F19LF20L (blue) at 6, 4, and 2 μM in the upper, middle, and lower panel, respectively. All samples contain 12 μM ThT, 20 mM sodium phosphate, 200 μM EDTA, and 0.02% NaN3, pH 8.0. Four replicates of each peptide at each concentration are shown, and the data shown are representative of three such experiments. F19L and F19LF20L have a longer half-time than wt, most significant for F19L, while F20L has a shorter half-time.
